Admin UI guide
The manager serves a React console at http://<host>:20900/ui/. Superusers and tenant admins get the full operator console: it manages tenants, databases, pools, users, and access control, and surfaces live node and statement telemetry. Regular (kind=user) tenant users can log in too, but land on a self-service Profile page instead of the operator console. Neither view is an end-user query tool; clients run SQL over the FlightSQL edge, not through this UI.
Every screen here is backed by a REST endpoint documented in the REST API reference; the UI is a thin front end over the same /api/* calls shown on the operator pages. Where a screen maps to a task already covered in prose, this guide links there rather than repeating it.
The screenshots below are from a local demo deployment with the bootstrap TPC-H tenant.
Signing in
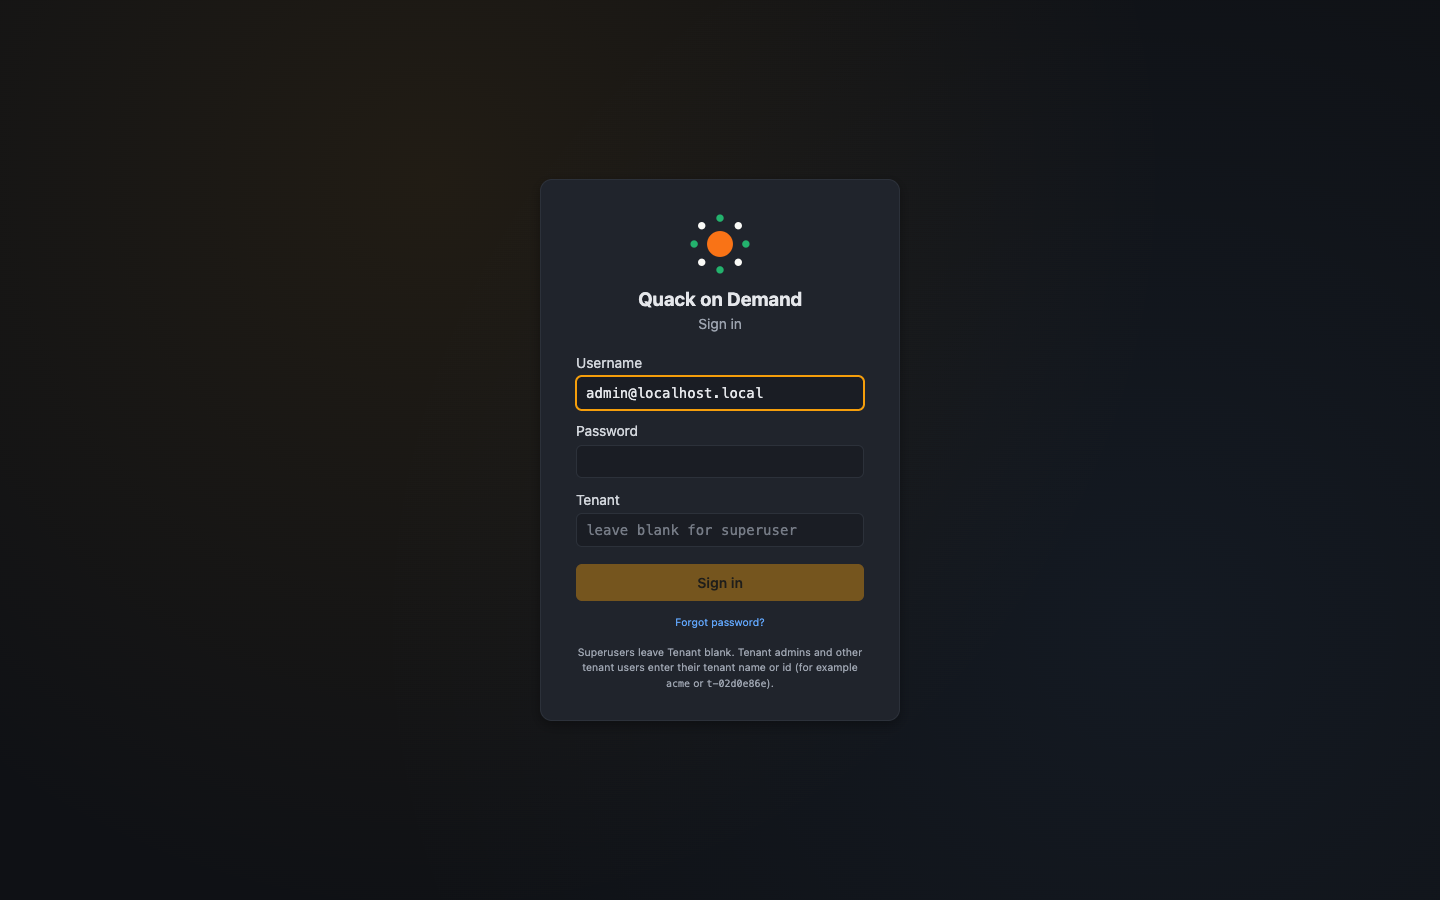
The login screen takes a username, password, and an optional Tenant ID. The tenant field is the realm signal:
- Leave it blank to log in as a system superuser. Credentials are validated against the manager's global auth providers (
quack-flightsql.auth.*) and the matchingqodstate_userrow must havetenant IS NULL. This path (and the OIDC single sign-on login) is admin-only. - Fill it in (e.g.
t-02d0e86e) to log in as a tenant user. Credentials are validated against THAT tenant's configured provider, and the matchingqodstate_userrow must havetenant = <id>. A tenant admin lands on the operator console scoped to that tenant; a regular (kind=user) principal with a database-backed password login lands on the Profile page instead.
There is no separate superuser checkbox; the field's presence is the only signal. Pre-existing scripts that called /api/auth/login with a tenant value for the bootstrap admin need to drop the field (or send an empty string) after upgrading.
When the server has no auth providers configured (the no-auth dev mode), the login screen is skipped and the session is a synthetic anonymous superuser. The signed-in user and role appear in the user pill at the bottom of the sidebar; the no-auth mode shows anonymous / no-auth.
For how credentials are validated and how to wire an external provider, see Authentication and Authentication providers.
Profile page (regular users)
A tenant-scoped kind=user principal signing in with a database-backed password login (not OIDC, not the blank/superuser login) lands on a stripped-down Profile page (/ui/settings/profile) instead of the operator console. Their sidebar has no tenant switcher and holds only Settings > Profile, Workbench when the Starlake integration is configured, and Sign out; no operator route is even mounted, and any other URL lands back on the profile. The page lets them change their own password (username, tenant, and role are read-only) and view their own access statistics - their usage and recent statements, the same data the Usage and Statements pages show an admin, scoped to just that user.
The server enforces this independently of the UI: such a session's REST calls are demoted to a fixed allowlist (whoami, logout, /api/profile/usage, /api/profile/statements) and answer 403 admin_required on everything else, so a deep link to an operator page 403s on its first fetch rather than leaking data. The qod profile usage / qod profile statements CLI commands hit the same two endpoints.
Navigation
The console is laid out as a left sidebar and a content column. From top to bottom the sidebar holds the brand, the tenant switcher, the navigation tree, and a footer with the user pill, the collapse toggle, and Sign out.
The navigation tree, for an admin:
- Dashboard - the live node dashboard. Under it, Fleet servers (see Servers (fleet)) appears only for a superuser on a manager running the fleet runtime.
- Tenant - Databases (with Catalog, the catalog browser, nested under it), Pools, Maintenance, Branches, Auth Provider, and Access Control.
- Users & Access Controls - Users, Groups, and Roles (see Users and access control).
- Audit - Control Plane, Statements, and Usage. The whole group is hidden when
QOD_TELEMETRY_STORE=none; deep links to the three pages keep working and render a "telemetry is disabled" state. - Workbench - only when the Starlake integration is configured; see Workbench.
- Settings - Config (superusers only) and Profile (your own password change, usage, and statements).
Visibility in the sidebar is a convenience only: the server enforces every gate itself, so a deep link to a page you may not use 403s on its first fetch (or, for Config and Fleet servers, is not even routed for a non-superuser).
Tenant switcher
The switcher at the top of the sidebar sets the tenant every page works in. What it offers depends on who is signed in:
- A superuser picks any tenant or All tenants (the default after sign-in). The same list also carries Manage tenants..., which opens the Tenants list where tenants are created, enabled or disabled, and deleted, and New tenant, which opens that list with the create form already open.
- A tenant admin of a single tenant sees that tenant as a fixed label, not a list.
- An admin who administers several tenants (OIDC sign-in with admin grants on more than one tenant) can switch among exactly those tenants, starting on the tenant they signed in through.
Under All tenants, the entries that need one tenant (Databases, Catalog, Pools, Maintenance, Branches, Auth Provider, Access Control, Groups, Roles) stay visible but greyed out with a "Pick a tenant first" hint; reaching one of them by URL shows a "Pick a tenant" card. Dashboard, Users, Control Plane, Statements, and Usage work under All tenants and then cover every tenant. A tenant admin who edits the URL to name a tenant they do not administer is sent back to their own tenant, and an unknown tenant shows a "Tenant not found" card with a link to the tenant list.
Switching tenant keeps you in the same section: from /ui/t/acme/pools picking globex goes to /ui/t/globex/pools. A detail page (a pool, a catalog table) drops back to its list, since the pool or table belongs to the previous tenant, and switching to All tenants from a tenant-only section goes to the dashboard. Each page starts fresh on a switch, so no filter or selection carries over from the previous tenant.
URLs
The tenant is part of the URL, so every page is bookmarkable and shareable:
| Section | URL |
|---|---|
| Dashboard | /ui/t/<tenant>/dashboard or /ui/all/dashboard |
| Databases | /ui/t/<tenant>/databases |
| Catalog | /ui/t/<tenant>/catalog (table detail: /ui/t/<tenant>/catalog/<db>/<schema>/<table>) |
| Pools | /ui/t/<tenant>/pools (pool detail: /ui/t/<tenant>/pools/<db>/<pool>) |
| Maintenance, Branches | /ui/t/<tenant>/maintenance, /ui/t/<tenant>/branches |
| Auth Provider, Access Control | /ui/t/<tenant>/auth-provider, /ui/t/<tenant>/access-control |
| Users | /ui/t/<tenant>/users or /ui/all/users |
| Groups, Roles | /ui/t/<tenant>/groups, /ui/t/<tenant>/roles |
| Control Plane, Statements, Usage | /ui/t/<tenant>/audit/control-plane, .../audit/statements, .../audit/usage (or under /ui/all/) |
| Tenants list | /ui/tenants |
| Fleet servers | /ui/servers |
| Config, Profile | /ui/settings/config, /ui/settings/profile |
<tenant> is the tenant id (slug), for example /ui/t/acme/pools; the switcher shows the display name. The unscoped pages (tenants, servers, settings) keep the sidebar links pointing at the last tenant you worked in.
URLs from earlier releases redirect to their new homes, so old bookmarks keep working: /ui/nodes and /ui/ go to the dashboard, /ui/tenant/<t> to /ui/t/<t>/databases, /ui/pool/<t>/<db>/<pool> to the pool detail, /ui/catalog (and its table pages) to the catalog, /ui/users to Users, /ui/audit, /ui/history, and /ui/usage to Control Plane, Statements, and Usage, and /ui/config and /ui/profile to the settings pages. A legacy ?tenant=<t> query parameter becomes the /ui/t/<t> prefix; otherwise the redirect uses your default scope (All tenants for a superuser, your own tenant for a tenant admin).
Collapsing and small screens
The collapse toggle in the sidebar footer shrinks the sidebar to an icon rail; the choice is remembered per browser. In the rail the switcher becomes a single letter (the tenant's initial, * for All tenants) that expands the sidebar when clicked. Below 900px wide the sidebar becomes a slide-out drawer opened from the menu button in the top bar; it closes on navigation, on a click outside, or with Escape.
Workbench
When the Starlake integration is configured, a Workbench entry opens Starlake in a new tab, signed in through a single-use SSO ticket minted for your session. It is the only entry besides Profile and Sign out that a regular (non-admin) user also gets. qod start --with-starflow and the Docker Compose starflow profile both configure it for you.
Dashboard
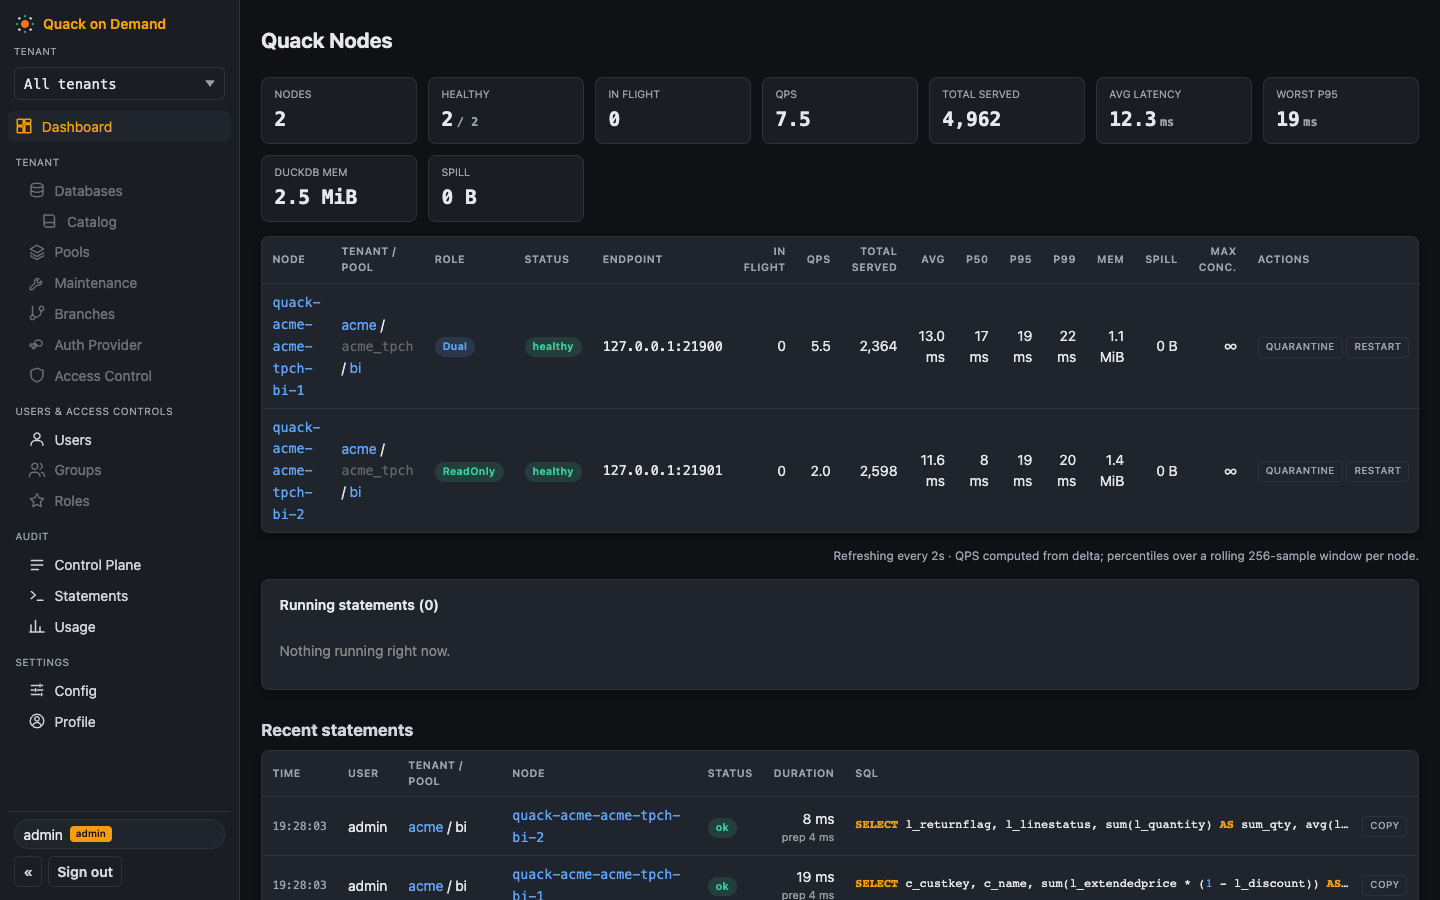
Dashboard (titled Quack Nodes) is the landing page and the at-a-glance operational view. A metrics strip across the top summarizes the deployment: node count, healthy count, statements in flight, QPS (computed client-side from deltas), total served, average latency, worst p95, DuckDB memory in use, and spill volume. The page follows the tenant switcher: with a tenant selected everything on it is narrowed to that tenant, under All tenants it covers the whole deployment.
Below the strip, a live table lists every Quack node grouped by tenant and pool: role, status badge (healthy / draining / unhealthy / quarantined), endpoint, in-flight count, total served, average and percentile latency (rolling 256-sample window), DuckDB memory, spill, and a per-node Max conc. column. Node ids are links that filter the page to that node (a Clear node filter button drops it); tenant and pool names link to the tenant's Databases page and the pool detail. For superusers each row also offers Quarantine / Unquarantine (stop routing new statements to the node; durable across restarts) and Restart (kill and respawn with the same id), both behind confirmation dialogs; the quarantine dialog warns when the node is the pool's last routable one. These are the UI forms of the incident-response endpoints.
A Running statements card above the Recent statements table shows active queries with the user, tenant/pool, node, a live elapsed counter, and the SQL; each row has a Kill button (best-effort stream close; the card reports when the statement had already completed before the kill arrived).
A Recent statements table at the bottom shows the last statements routed through the edge with a status badge (ok, denied, transient, permanent, no-node, no-pool, pin-lost, killed), duration (with the FlightSQL prepare-probe duration as subtext when the statement was prepared), the node that served it, and the SQL with syntax highlighting and a copy button. The page refreshes every 2 seconds.
Tenants
The tenant list (/ui/tenants, reached through Manage tenants... in the tenant switcher) shows every tenant with an enable/disable toggle per row (the disabled state is the data-plane kill switch: the edge rejects fresh handshakes for a disabled tenant), a delete action (refused while the tenant still has active pools), and a + New tenant form (also opened by New tenant in the switcher). Clicking a tenant name opens its Databases page.
What used to be the tabs of a tenant detail page are now separate sidebar pages under Tenant, each working on the tenant picked in the switcher and headed with its display name and id:
- Databases - create and manage the tenant's databases (tenant-dbs), with Catalog nested under it.
- Pools - create pools bound to a database and operate them.
- Maintenance and Branches - per-database maintenance and branch review.
- Auth Provider - the tenant's auth provider and its configuration.
- Access Control - who decides data access for the tenant: standard QoD grants (mode
qod, or the manager default) or the tenant's own OPA server (its URL, policy path, and a write-only bearer token that is never displayed).
Databases and federation
The Databases page lists the tenant's databases with a kind badge (ducklake, duckdb-file, or memory), schema, and data path (marked (inherited) when the manager default applies). The Tables count is a link that opens the catalog browser inline, including the database's snapshot history (see Snapshots and time travel); Federation (with a badge counting the database's federated sources) opens the federated-source panel. Disabled databases render dimmed with a (disabled) marker.
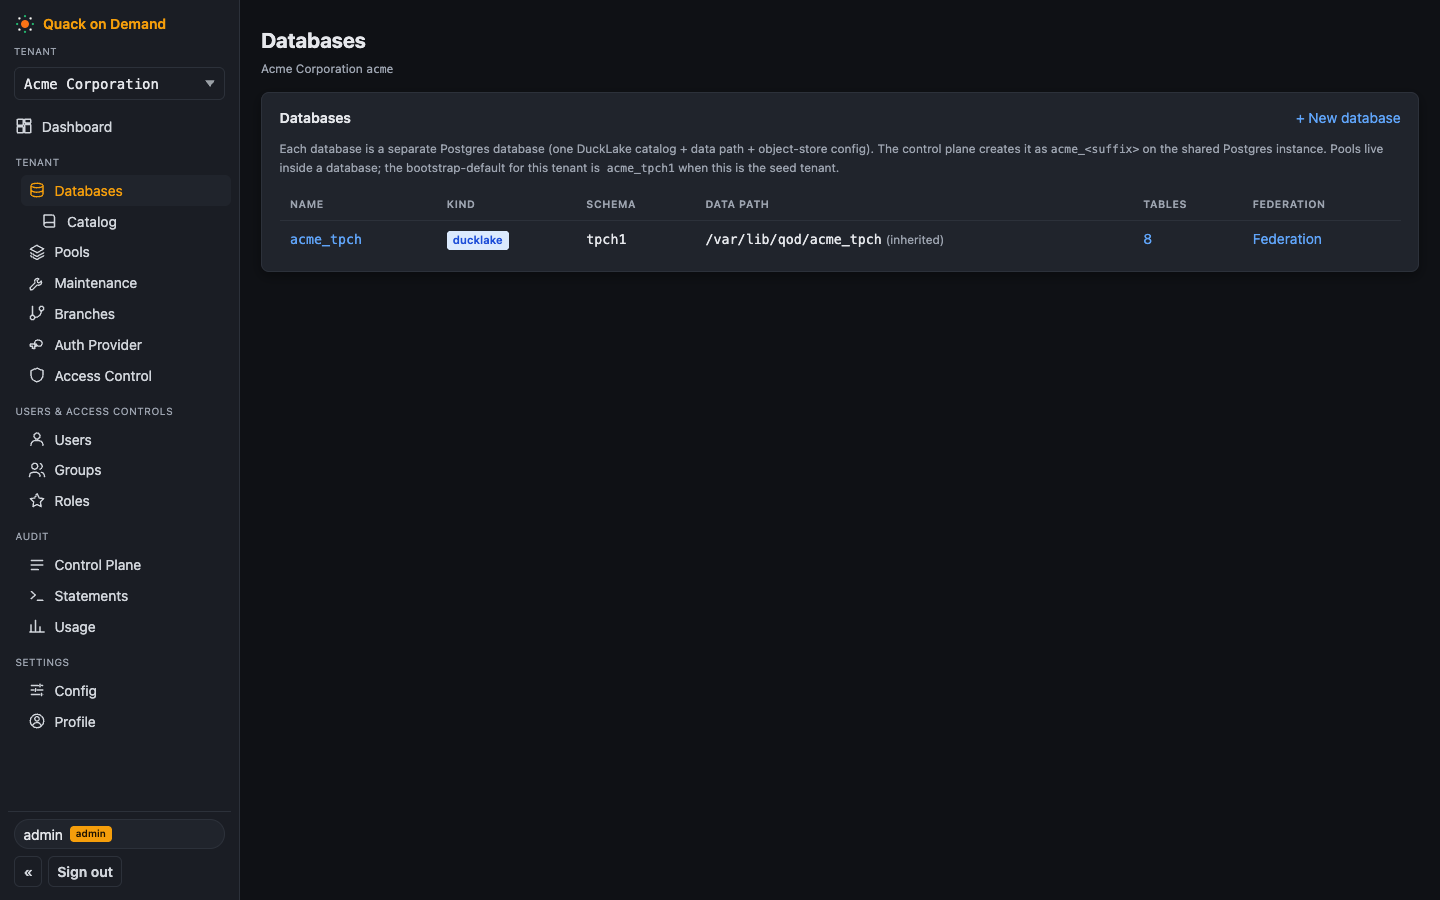
Clicking a database name opens its edit form: default database and schema, init SQL, and the metastore and object-store maps as key=value lines. The kind is immutable. Editing the metastore, object store, or init SQL restarts all the database's nodes immediately (in-flight statements on them fail); the form warns about this, and the save button changes to Save and restart nodes when such a field is dirty. pgPassword is kept unless a new value is supplied (sending one rotates it). The form also carries the Delete database action.
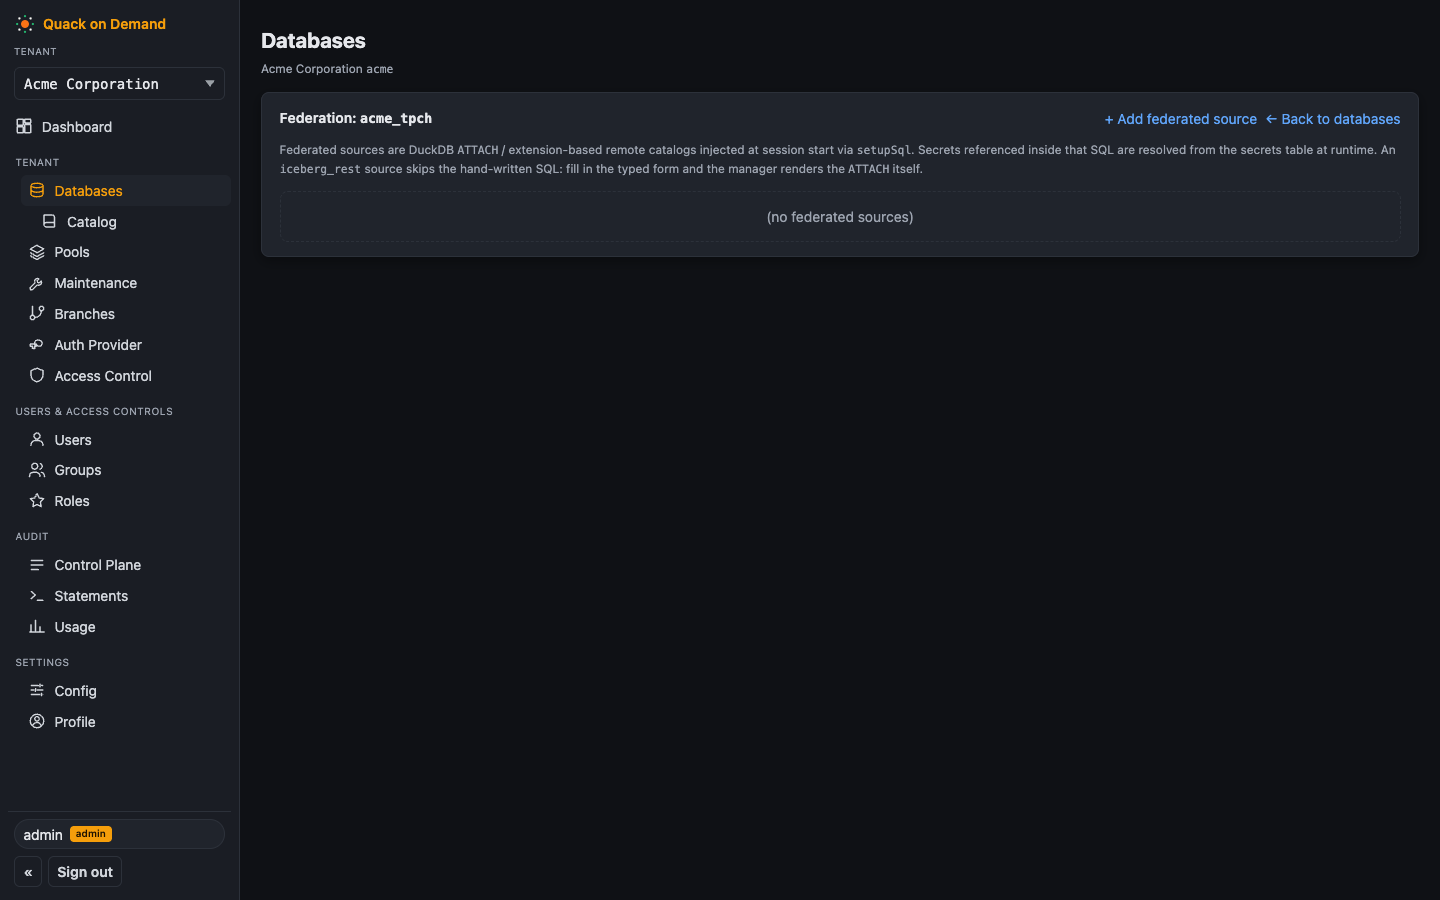
Clicking Federation opens the federated-source panel, where DuckDB ATTACH / extension catalogs are registered (with their secrets) and injected at session start. See Federation.
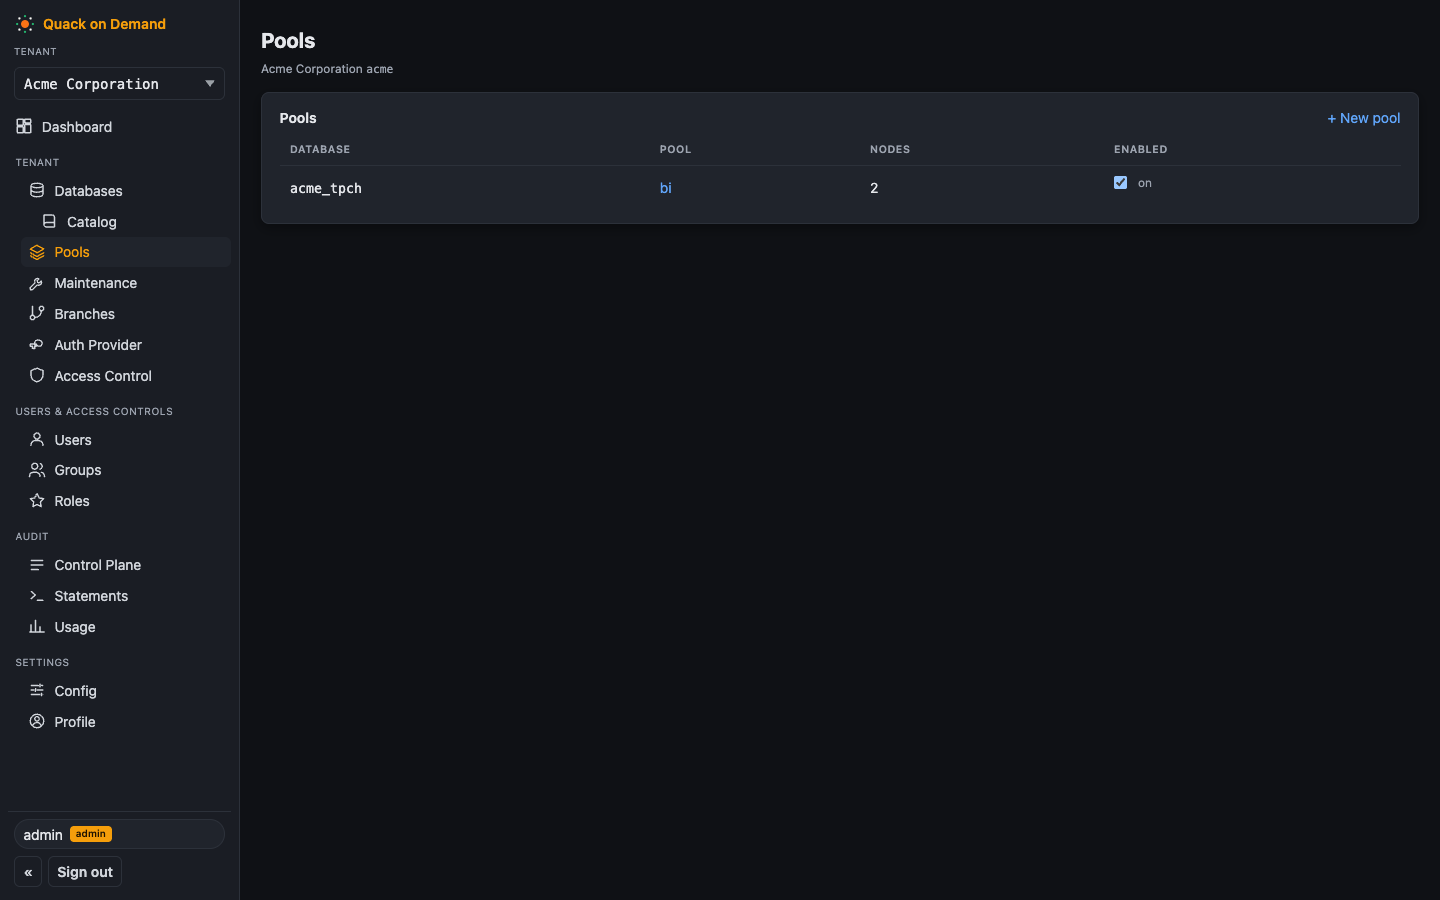
Pools
The Pools page lists each pool with its database, node count, and an enable/disable toggle. Clicking a pool name opens the pool detail inline; the same detail is addressable at /ui/t/<tenant>/pools/<db>/<pool> (what the dashboard's pool links open). The lifecycle actions (Scale, Suspend, Delete) live on the detail page.
The New pool form takes the role distribution, optional pool init SQL, optional CPU and memory limits for the pool's node pods (sliders; applied as both request and limit on Kubernetes), a Create disabled toggle (nodes spawn, but the edge rejects fresh handshakes until enabled), and the node-placement section described below.
Pool detail
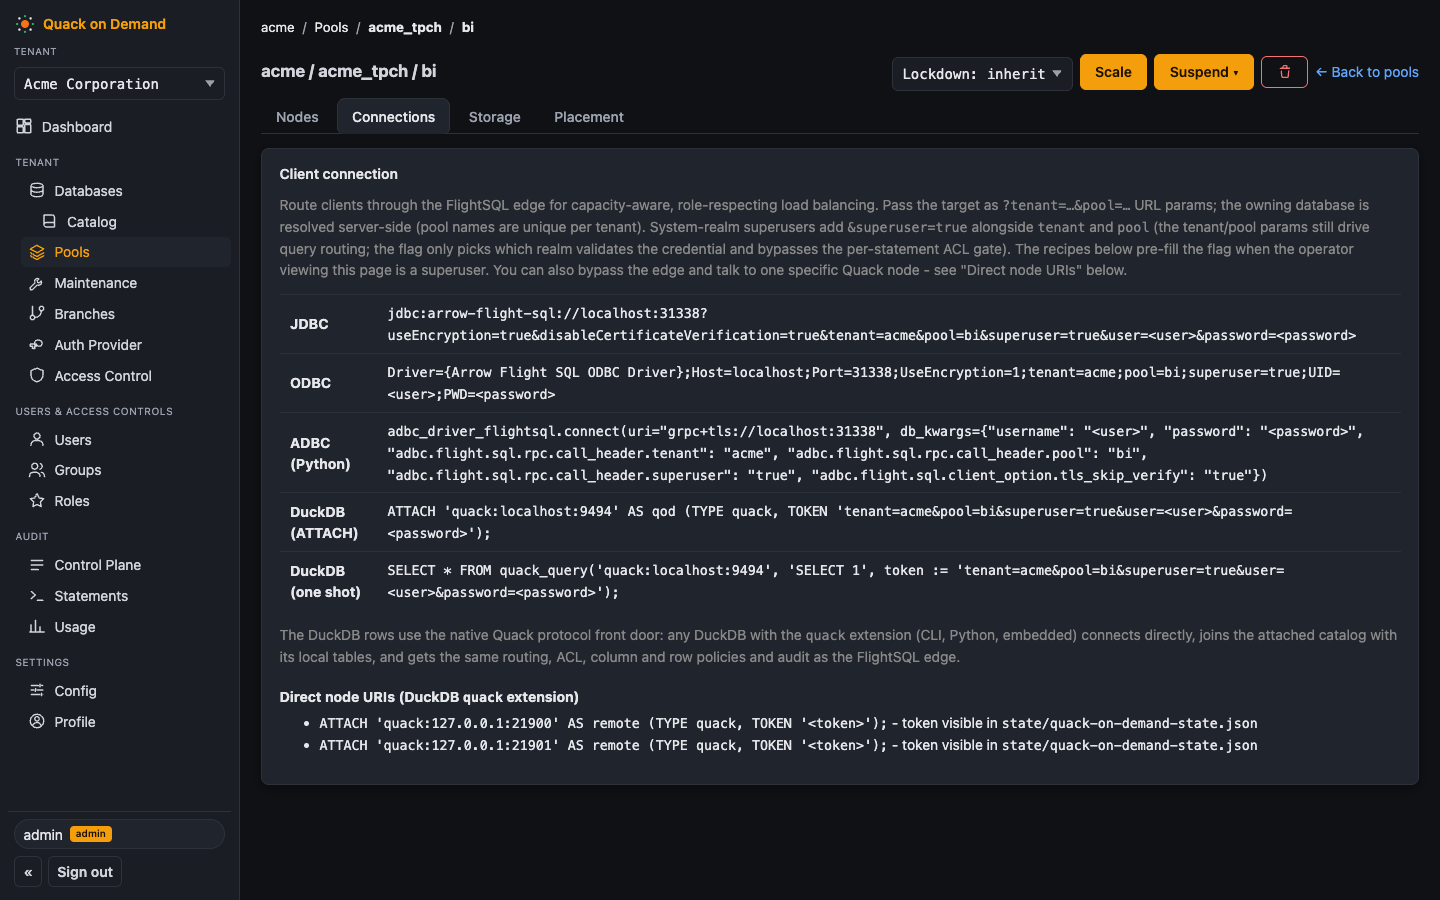
The pool detail page has tabs for Nodes, Connections, Storage, and Placement. Its header carries the pool's lifecycle actions:
- Scale opens a modal with the target role distribution (WriteOnly / ReadOnly / Dual counts; the target size is their sum) and, when scaling down, a Force checkbox that skips the graceful drain (outstanding queries fail).
- Suspend is a menu with three ways to zero nodes: Hibernate (nodes stop, the role distribution is kept, and the first query wakes the pool automatically), Drain (finish routing, then stop; stays down), and Kill (stop immediately; outstanding queries fail; stays down). A hibernated pool shows a Hibernated badge and the menu is replaced by a Wake button.
- Delete (the trash button) removes the pool from the registry after stopping it.
- Superusers also get the pool's Lockdown override selector (
inherit | on | off), described in Hardening.
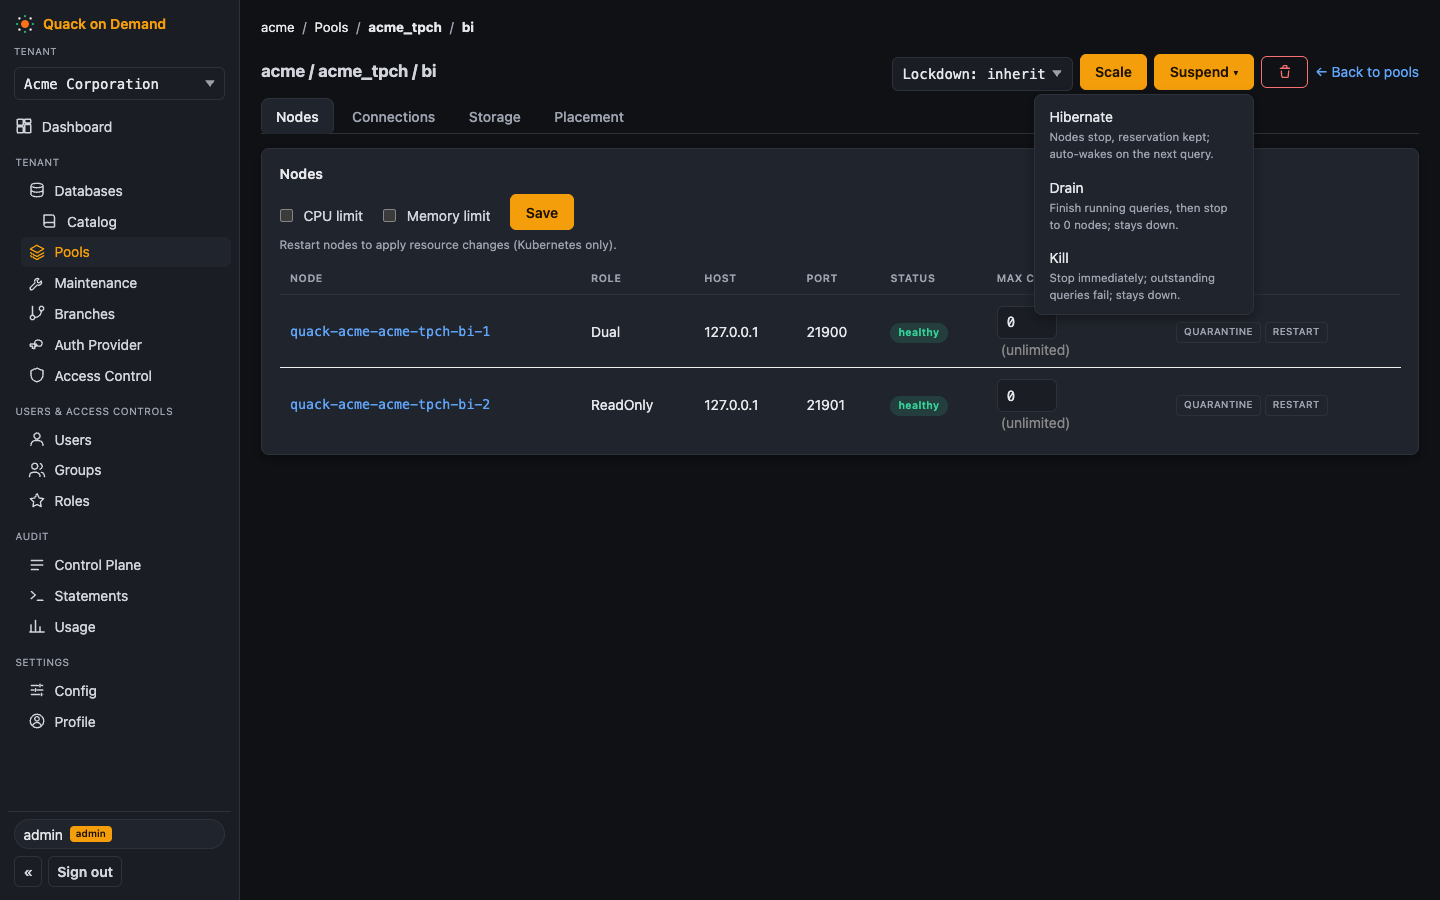
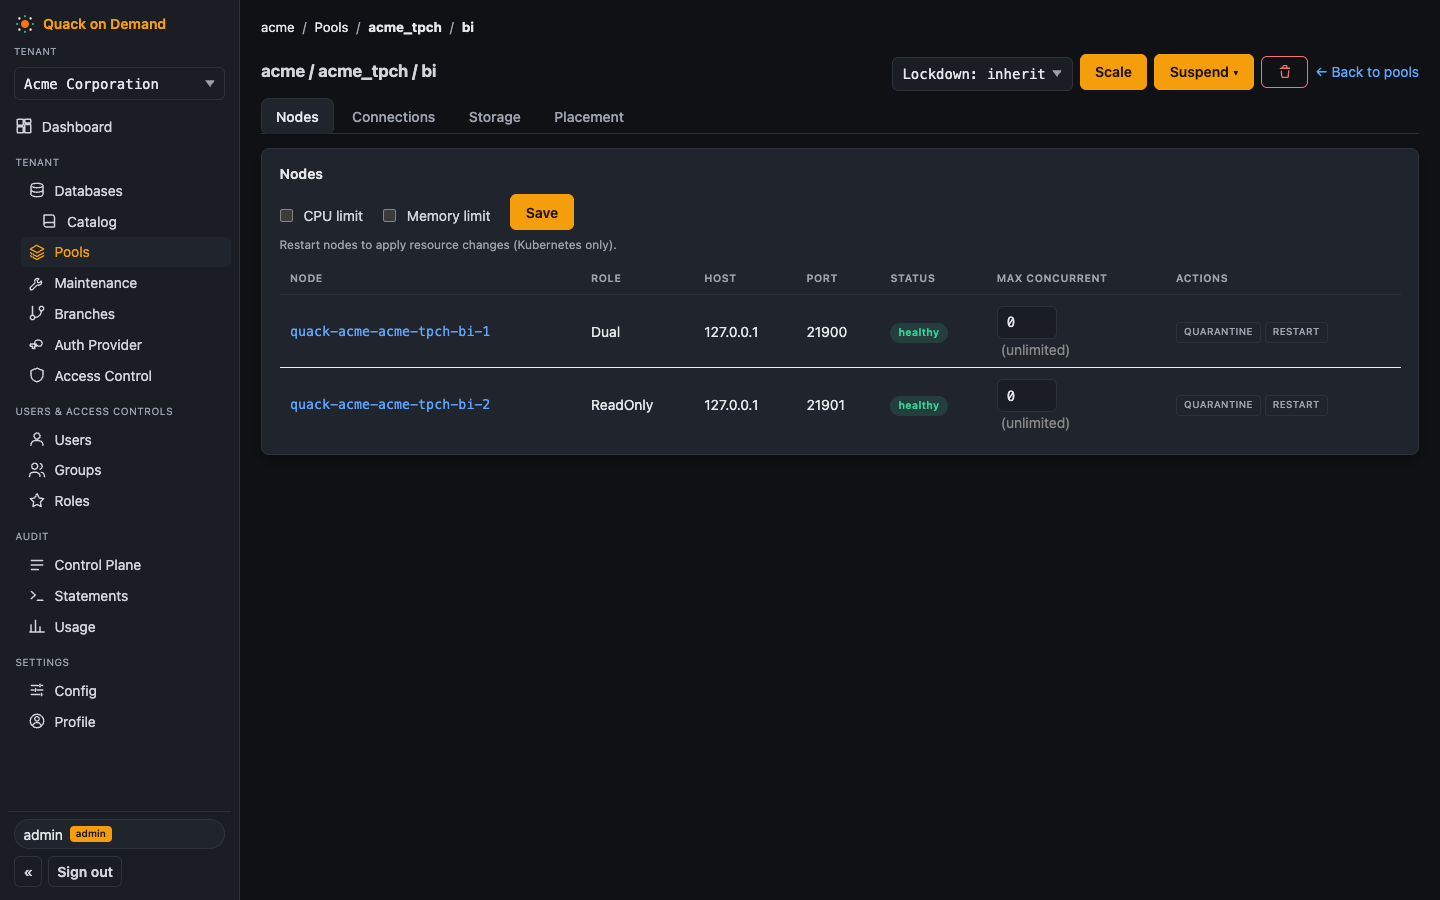
The Nodes tab shows the per-node table with role, host, and port, plus per-pool CPU limit and Memory limit editors (checkbox + slider, with a Save button; a note reminds that node restarts apply resource changes and that sizing is Kubernetes-only) and a per-node Max concurrent input (0 = unlimited, saved on blur). Superusers get the same Quarantine / Restart actions as on the Dashboard.
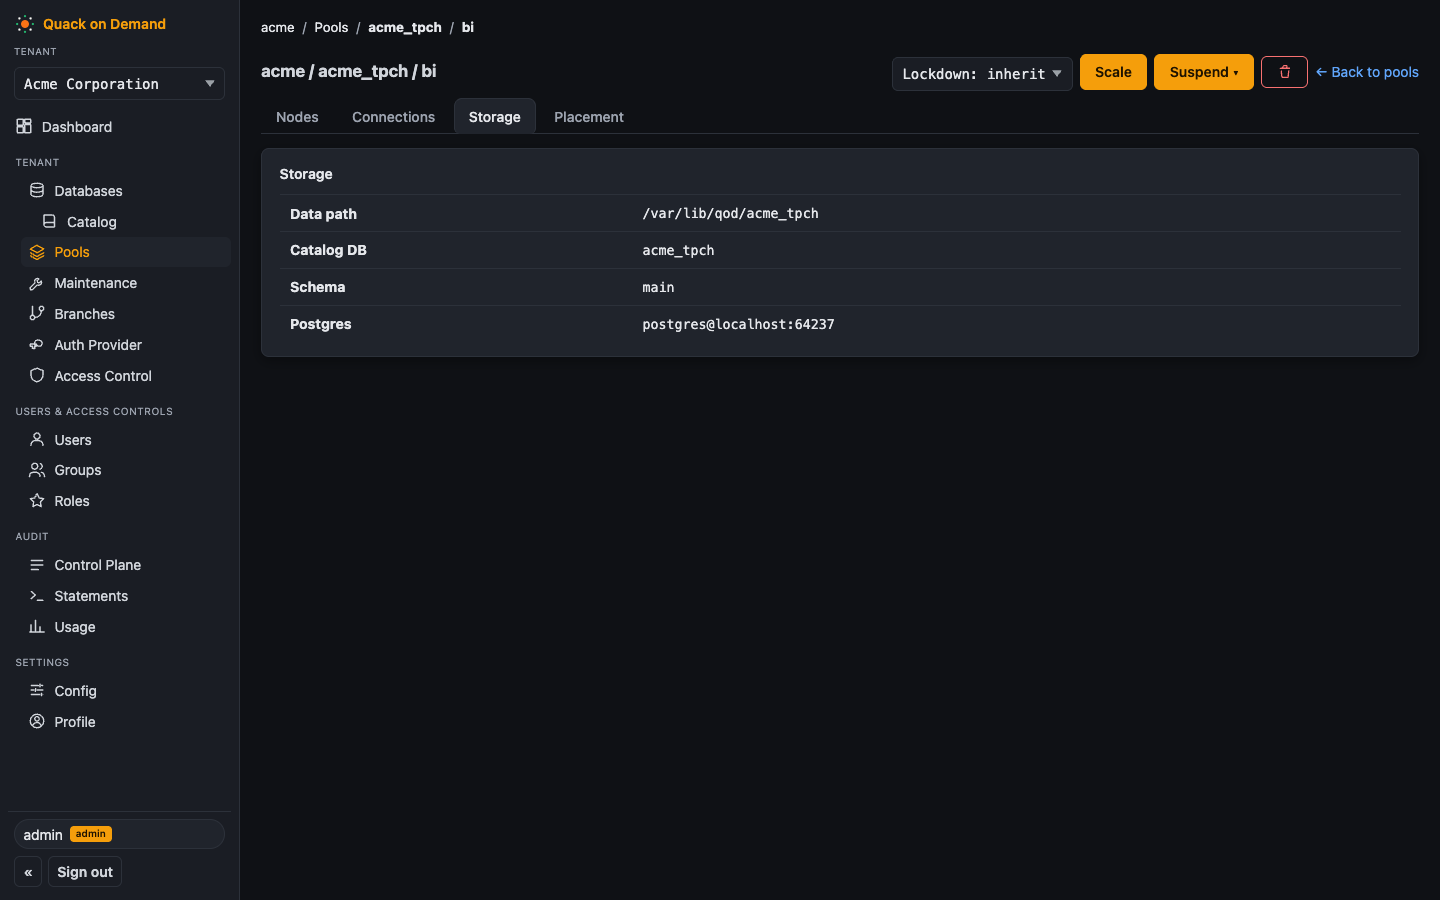
The Connections tab gives ready-made JDBC, ODBC, and ADBC (Python) connection recipes pre-filled with the pool's tenant and pool (and superuser=true when the operator is a superuser), plus direct per-node ATTACH URIs for the DuckDB quack extension (see Connecting clients). The Storage tab shows the pool's effective metastore: data path, catalog database, schema, and Postgres endpoint.
Node placement
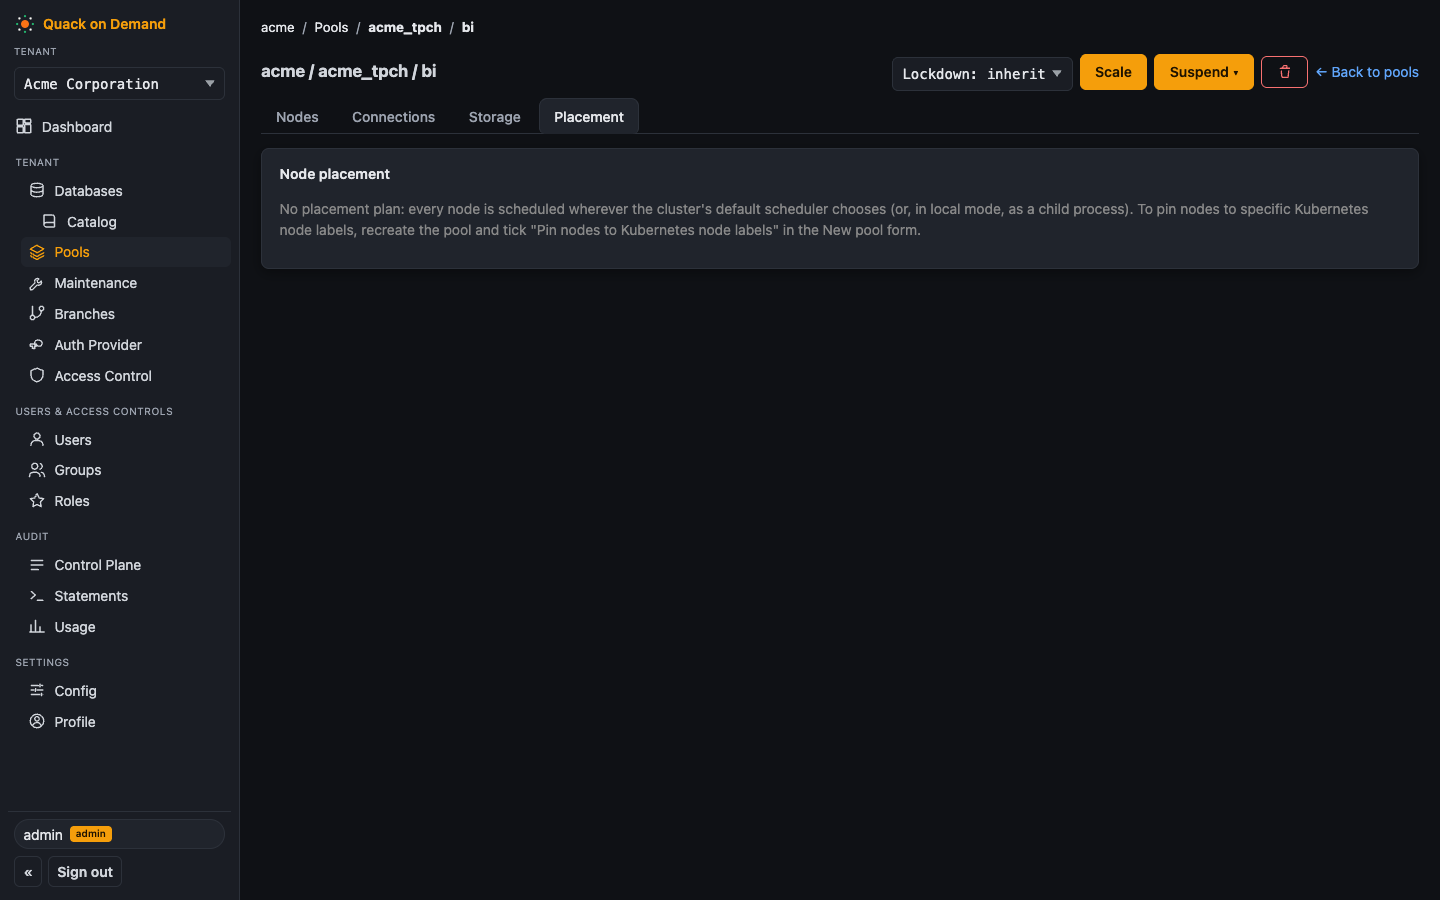
When you create a pool, the New pool form has a Node placement section. Enabling "Pin nodes to Kubernetes node labels (cohorts)" opens the cohort editor: per-cohort read-only / write-only / dual counts and a nodeSelector of key=value Kubernetes node labels, with + add cohort for additional cohorts. On a manager that is not running on Kubernetes, the form shows a warning that placement is saved with the pool (and survives a manifest export to a K8s cluster) but ignored at runtime, where the local backend spawns every node regardless. The pool detail's Placement tab renders the persisted plan: per-cohort role counts, nodeSelector, and Kubernetes tolerations. The model is described on the Pools and cohorts page.
Maintenance
The Maintenance page manages managed DuckLake maintenance per database. Pick one of the tenant's DuckLake databases to get its panel:
- Policy form, bound to the database-level scope: the enable toggle, retention days (annotated as the bound on time-travel, undrop, and history horizons), compaction knobs (target file size, small-file threshold, rewrite threshold), cleanup grace and orphan age, and the cadence cron. Unset fields show the effective defaults as placeholders; the first save creates the policy row.
- Overrides table listing schema- and table-scope policy rows with their overriding fields; rows can be deleted here (creating overrides needs the qod CLI for now:
qod maintenance policy-upsert --scope-kind schemaor--scope-kind table). - Run history, newest first with load-more and a Refresh button that re-fetches the list: trigger (cadence, threshold, or manual), scope, status (
succeeded/failed/partial), per-step counters, bytes reclaimed, and duration. - Run maintenance now under an advanced disclosure, the manual escape hatch. Scope is a select: whole database (full chain) or single table (table-safe steps), the latter revealing schema and table inputs. Operations are checkboxes over the chain vocabulary (
flush,expire,merge,rewrite,cleanup,orphans); leaving all checked runs the full chain, unchecking restricts the run to the checked subset. It is refused with a conflict while a run is already queued or running for the database.
Maintenance is double-opt-in: the service runs by default but every database starts disabled, and the first enable expires all unpinned snapshots older than the retention window on the next tick. Protect snapshots with tags first (see Snapshots and time travel).
Branches
The Branches page is the review and approval surface for branching. Pick one of the tenant's DuckLake databases (branch catalogs themselves are not listed; they are addressed through their parent):
- Create branch: a name and an optional TTL in hours (blank for the server default,
0for never). Invalid names, duplicates and the per-database cap surface as the server's error text. - Branch list: live branches with status, owner, fork snapshot, creation and expiry; a checkbox includes merged, discarded and expired history rows.
- Expand a branch for its change set: each touched table with its kind (created, dropped, recreated, modified, altered), insert/delete/update counts and a per-table merge verdict, the conflicts against main, anything v1 cannot merge, and the branch's merge requests with proposer, approver, main snapshot before and after, and the tag. The rows link on a table opens the row-level diff between the fork and the branch head, filterable by change type and paginated.
- Actions per row: propose on an open branch, merge on a proposed branch (after a confirmation), discard on any live branch. Merge is refused for the proposer's own identity, so review as a different admin than the agent or user who proposed.
Servers (fleet)
Superuser admins see a Fleet servers entry under Dashboard in the sidebar when the manager runs the fleet runtime (the page itself, /ui/servers, is routed for every superuser). On a manager running the fleet runtime it lists every server that joined with qod fleet join: name, address and node port, a liveness badge (reachable / unreachable / dead, with the seconds since the last heartbeat when not reachable), reported cores and RAM, the node it runs with a link to that node's pool, the server-reported node state (an error badge carries the last error on hover), and a Version column with the qod and DuckDB versions. The table refreshes every few seconds.
A server waiting for join approval carries a pending approval badge and an Approve action; the address column adds from <address> when the heartbeat came from an address other than the advertised one, which is the address to check before approving.
Each row offers Drain (or Undrain on a drained server, flagged with a drained badge) and Remove. Remove asks for an in-page confirmation and stays disabled while an approved server is reachable and not drained: drain it, stop its qod fleet join process, then remove. A pending server can be removed at any time; stop its qod fleet join process too, or it re-joins as pending. On any other runtime the page only states that the manager does not run the fleet runtime.
In fleet mode the Pools page also shows an N pending badge next to the node count of a pool whose slots wait for a server, suffixed (no server fits) when idle servers exist but none has enough RAM for the pool's memory setting.
Users and access control
The RBAC console is the Users & Access Controls group of the sidebar: three separate pages, each working on the tenant picked in the tenant switcher. Under a tenant, Users lists that tenant's users; under All tenants it lists every user, superusers included, and a superuser gets a Superusers only checkbox that narrows the list to rows with tenant IS NULL. Groups and Roles need one tenant and are greyed out under All tenants. For a tenant whose auth provider is an external OIDC IdP, the Users page notes that accounts authenticate against the IdP, the rows are pre-provisioned shells that carry roles, groups, and pool grants, and password edits are disabled.
- Users - create users, set their account kind (admin or user), and assign roles, groups, and pool grants. The create form's Roles and Groups checkbox dropdowns list the tenant's roles and groups (built-ins first), start preselected on
qod_all_tablesandqod_all_pools(full access to every table and pool of the tenant), and must each keep at least one entry; they are disabled for a superuser, who takes no memberships. - Groups - define groups and the roles they carry.
- Roles - define roles and their table permissions.
The four built-in roles and groups (qod_*) carry a built-in badge. They have no delete action, a built-in role opens read-only (its permissions and policies are fixed), and a built-in group only lets you add and remove members.
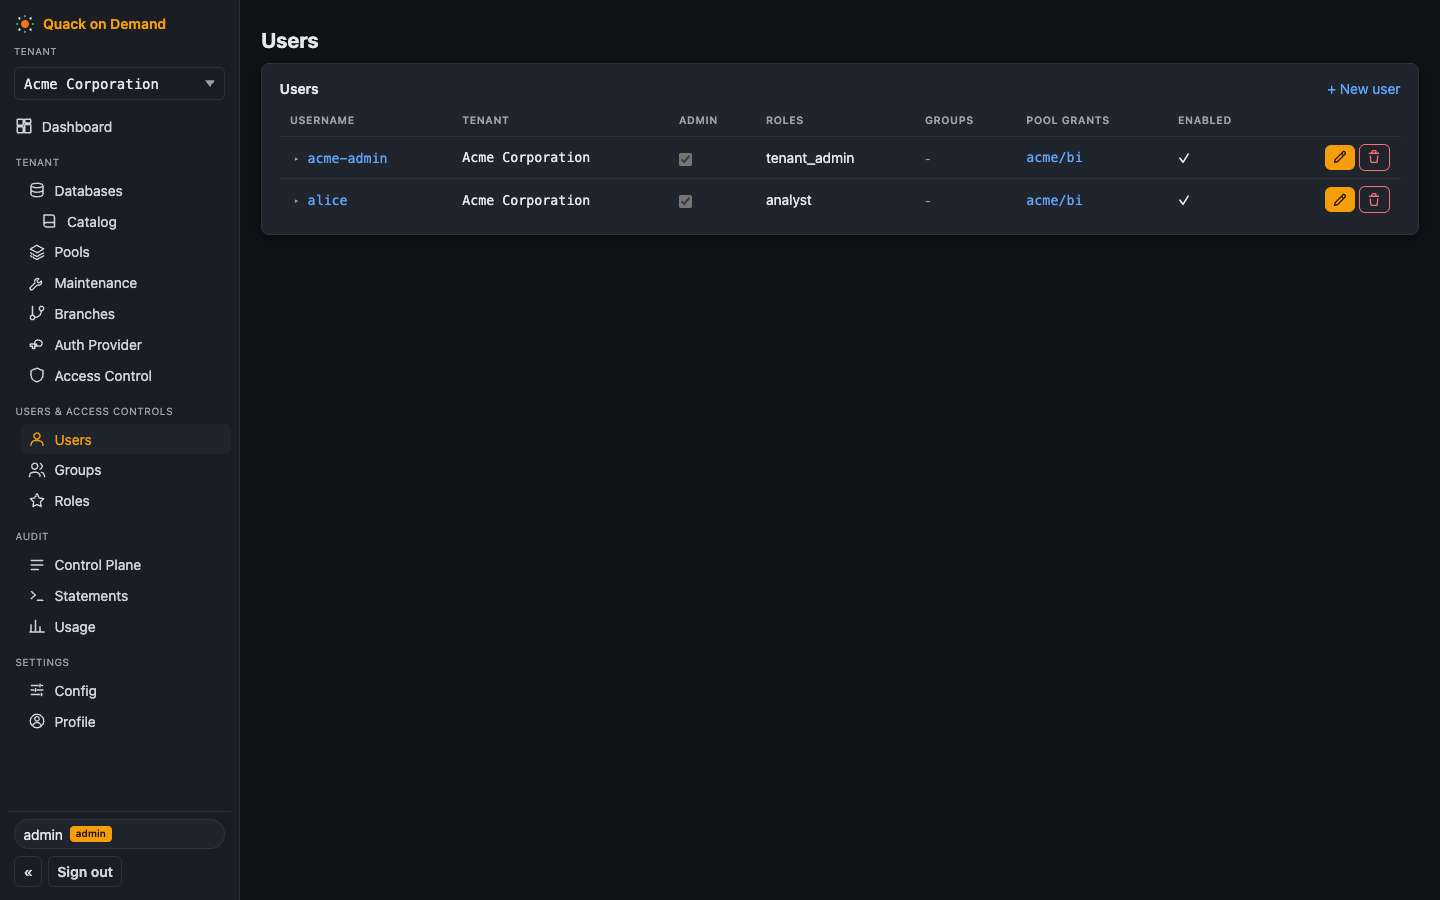
The Users page lists each user with their assigned roles, groups, and pool grants.
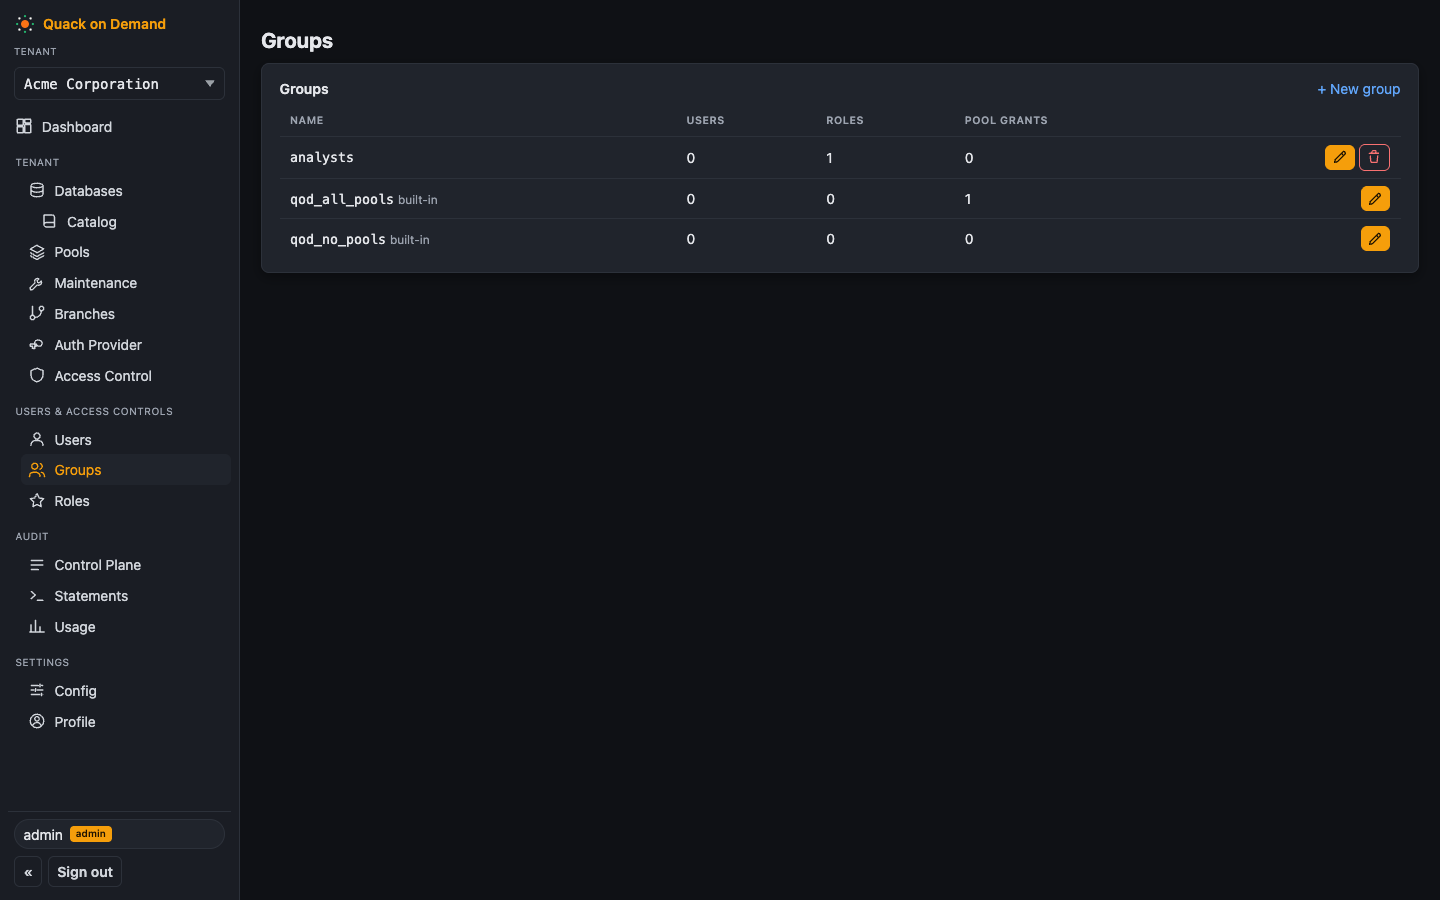
The Groups page shows each group with its user, role, and pool-grant counts.
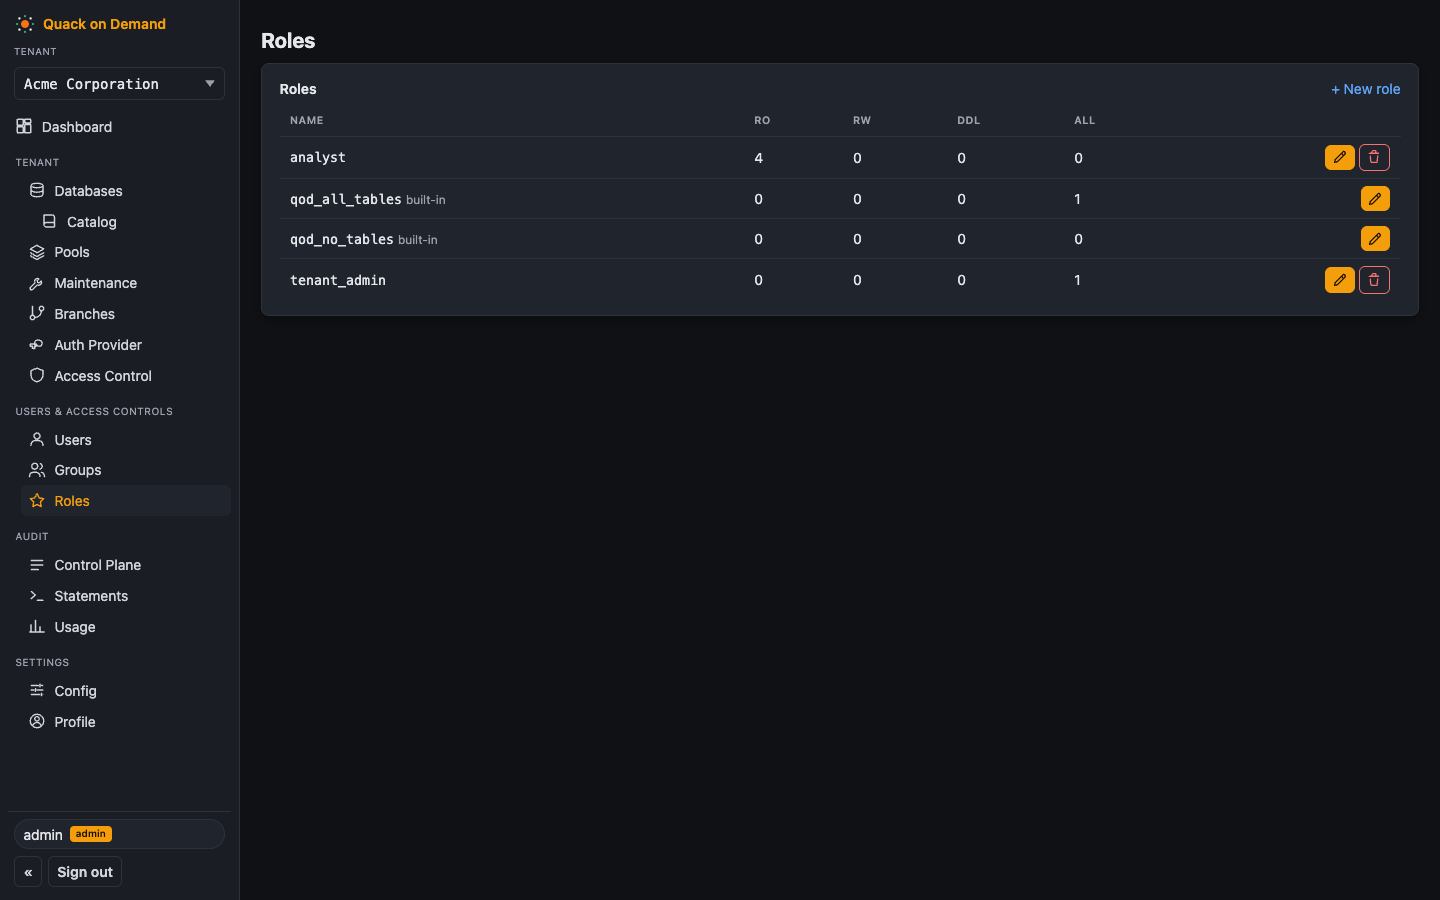
The Roles page lists each role with a per-verb count (RO / RW / DDL / ALL) of its table permissions, and + New role plus per-role edit and delete actions.
The model these screens edit (the EffectiveSet, verbs, wildcards, the two gates) is described in the Access control model; the step-by-step grant flows are on the "Administering access" page.
Catalog browser
The catalog browser lists the schemas and tables of a database (the DuckLake catalog). It is reachable from Tenant > Databases > Catalog in the sidebar, at /ui/t/<tenant>/catalog, for the tenant picked in the switcher, with a database selector (preserved in the URL as ?tenantDb=), and contextually from the table-count links on the Databases page. Use it to confirm what a pool actually exposes, including federated catalogs attached to the database. A database with external Iceberg catalogs also lists them, in both places; see Iceberg catalogs.
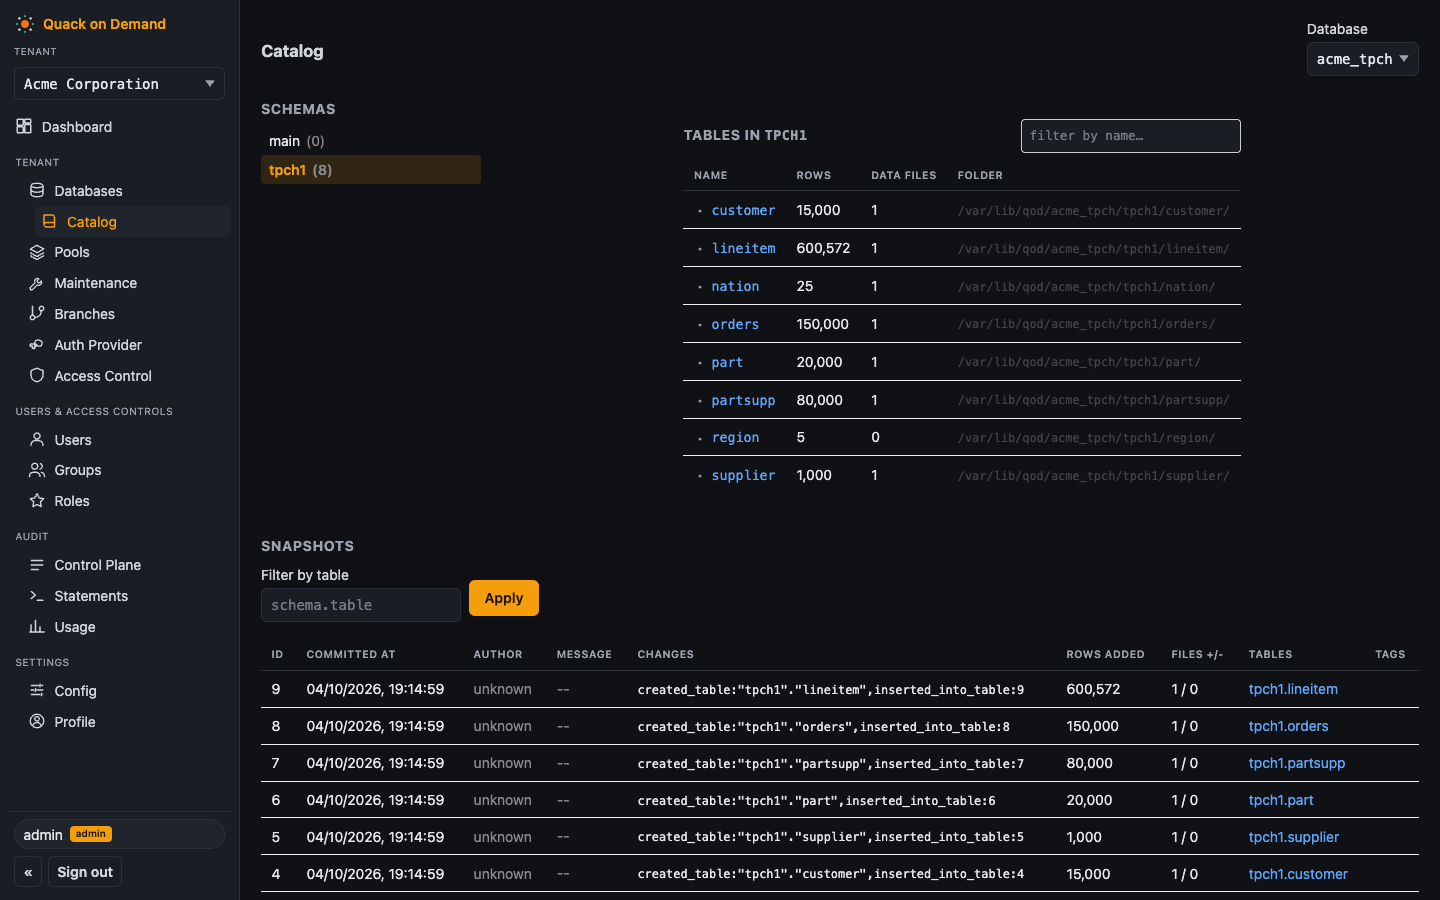
Clicking a table opens its detail page (/ui/t/<tenant>/catalog/<db>/<schema>/<table>), with breadcrumbs back to the catalog and links to the owning tenant and its live nodes. It shows a summary (row count, data-file count, total parquet size, folder), the column list (name, type, nullability, primary-key flag), and the table's parquet files with per-file size, row count, and snapshot id.
Snapshots and time travel
Below the table list, a Snapshots panel shows the database's DuckLake snapshot history, newest first: snapshot id, commit time, author (the authenticated principal who triggered the change; "unknown" for pre-existing snapshots with no stamp), commit message (the SQL verb or manual description), the raw change summary (created_table:..., inserted_into_table:...), rows added, files added / removed, and the affected tables. Each affected table links to its detail page as of that snapshot. The panel loads 200 snapshots at a time; Load older snapshots fetches the next page (keyset pagination, so new commits do not shift the window while you browse). A filter box above the table narrows the timeline to snapshots that touched a specific table by name.
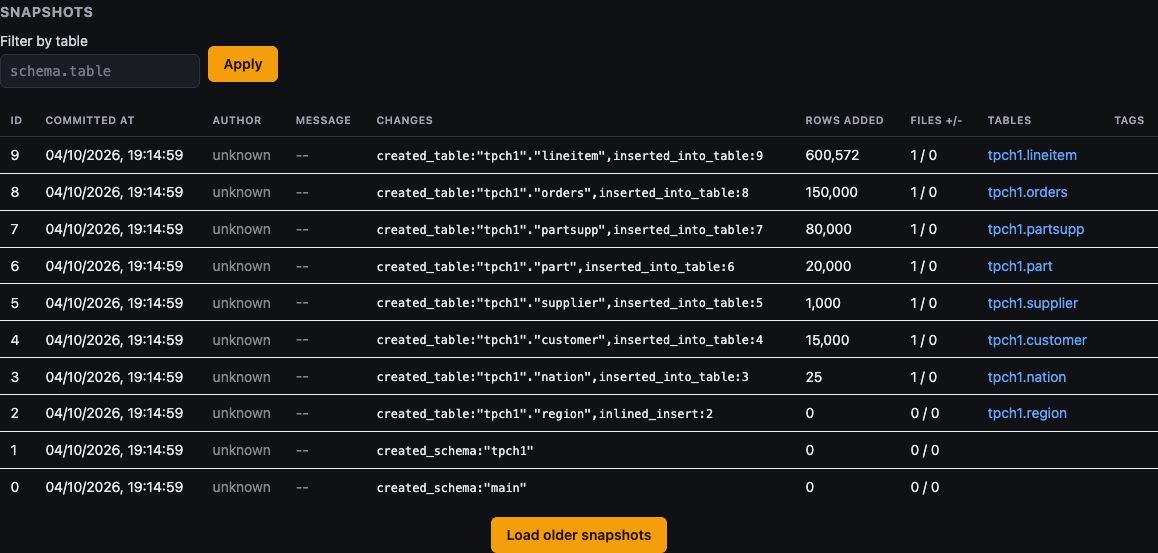
Each snapshot row also carries its tags: named handles (chips) you create with the row's + tag button, optionally with a retention hold ("protect this snapshot"). Protected tags show a hold badge and pin their snapshot against maintenance expiry; deleting one asks for confirmation since it releases the pin. A tag whose snapshot has since been expired renders dimmed with a missing badge. When holds exist, a summary line above the table counts the pinned snapshots. Tag names are per-database, 1 to 128 characters, and never all digits, so they stay unambiguous next to snapshot ids.
On the table detail page, a Snapshot selector switches between the current state and any listed snapshot: the summary, column list, and parquet files re-render as of the chosen snapshot, a banner recalls which snapshot is shown, and back to current drops it. The view is addressable directly with the ?asOf=<snapshot id> query parameter (what the panel's deep links use); the selector lists named tags first, so you can time-travel by name, and API callers can use ?asOfTag=<name> as an alias (supplying both is rejected). You can also view data as of a specific ISO-8601 timestamp: supply ?asOfTs=<timestamp> (e.g. 2026-07-09T14:30:00Z) and the manager resolves it to the nearest snapshot at or before that moment, surfaced in the page banner. Picking a snapshot where the table did not yet exist shows a not-found message while keeping the selector usable, and an unknown snapshot id is a 404 rather than an empty render.
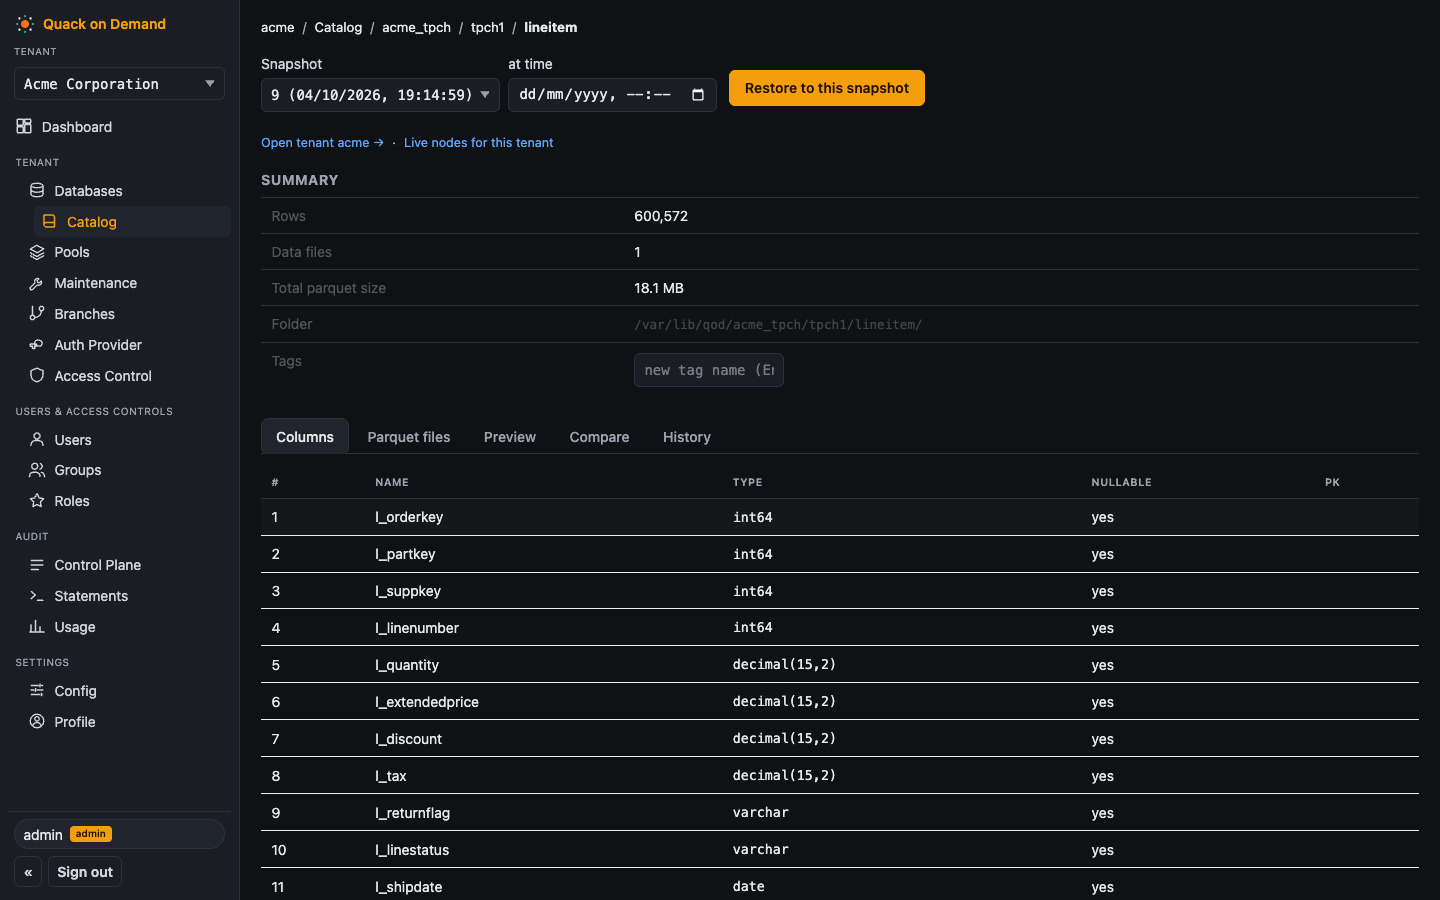
Snapshot semantics (linear history, inlined DML, retention and expiry) are covered in DuckLake catalogs.
Iceberg catalogs
Below the DuckLake schemas, an External Iceberg catalogs section lists the database's enabled Iceberg sources with their attach status; the section is absent when the database has none. It appears both on the Catalog page and in the catalog opened from a database's table count on the Databases page. Expanding an attached alias shows a namespace dropdown (preselected when the catalog has a single namespace) and that namespace's tables; an alias that is not attached shows its status badge instead.
Clicking an Iceberg table opens its detail page, with Columns, Files (path, content DATA / POSITION_DELETES / EQUALITY_DELETES, format, record count, no size), Preview (an "As of" snapshot selector), Compare (a row-level diff between two snapshots, filterable to added or removed rows) and History (snapshots newest first, filterable by operation, with a per-row action that previews that snapshot). The detail is always the current snapshot; time travel is in Preview and Compare. There is no restore, undrop or tagging here. The rules behind these views (admin-only, preview and diff running as the caller, string snapshot ids, the format v1 refusal and the diff size limit) are on External Iceberg catalogs.
Restore
Both the Snapshots panel and the History tab offer a Restore action on a live table: a restore chip next to each affected table in a snapshot row, and a Restore to this snapshot button in the History tab's commit detail drawer. Either entry point opens the same dialog, which runs a dry run immediately and shows the change summary that will be undone (rows inserted, deleted, and updated since the target snapshot) before enabling the Restore button; there is no way to write without seeing the preview first.
Restore is non-destructive: it writes the table's state at the target snapshot as a new forward
snapshot rather than rewriting history. The pre-restore state stays queryable by time travel, but
the table gets a new identity, so its History tab timeline restarts at the restore snapshot. If
the table changed between the preview and the confirm click, the execute call gets a 409 and the
dialog re-runs the dry run and asks you to confirm again against the fresh preview, instead of
silently restoring over the intervening write. The same flow is available from the CLI as
qod catalog restore (see Command reference).
Row preview
The table detail page carries a Preview section that fetches a sample of live rows from the table. The preview executes through the same FlightSQL pipeline as production data traffic: pool access-control lists apply (a user without SELECT on the table is denied), row-level and column-level security policies are enforced, and reads route only to ReadOnly/Dual nodes to avoid load on write-capable pool members. Every preview is recorded in the audit log. The preview is bounded (default 100 rows, configurable via the UI) and labeled with the snapshot it reflects ("current" or the snapshot id) so the operator knows the exact version being examined.
Schema diff
The table detail page offers a Compare action between any two snapshots: click the snapshot selector's diff icon, pick a second snapshot, and the manager computes a schema diff showing added columns, removed columns, columns that changed type, and columns whose nullability changed. Columns that were renamed are disambiguated by table identity and sequence order rather than name matching, so a rename is correctly surfaced as a remove + add rather than a false "no change." Diff results include deep links back to both the source and target snapshots for context, and you can re-run the diff by modifying the ?from=<snapshot-id-or-tag>&to=<snapshot-id-or-tag> query parameters.
History
The table detail page also carries a History tab: a filterable, newest-first timeline of the table's own DuckLake commits, distinct from the database-wide Snapshots panel above. Each row shows the commit time, an operation badge (create, insert, delete, update, alter, drop, maintenance, or unknown), the author and commit message, the row delta, and whether the commit changed the schema; filters above the table narrow by time range, operation, and author, and Load more pages the timeline with keyset pagination so new commits do not shift the window while you browse. Row and file deltas are computed from live DuckLake catalog metadata, so they are best-effort for older commits once maintenance has run: file-cleanup consumes the bookkeeping behind filesRemoved, and adjacent-file compaction can drop the rowsAdded/filesAdded of the insert commits it superseded. Clicking a row opens a detail drawer with the full snapshot id, schema version, and file counts, plus two deep links: View table at this snapshot jumps to the AS OF view covered above, and Compare schema loads the schema diff for this commit and the one before it and pre-fills the Compare tab's pickers and ?diffFrom/?diffTo URL params in the background; open the Compare tab to see the result. History survives table renames because it keys on the table's stable identity rather than its name. Null authors (commits made before author stamping was enabled) render as "unknown", matching the Snapshots panel.
Control Plane
The Control Plane page (Audit > Control Plane, /ui/t/<tenant>/audit/control-plane or /ui/all/audit/control-plane) shows a tenant-scoped, newest-first table of administrative and data-plane events. It is available to superusers and tenant admins. When QOD_TELEMETRY_STORE=none, a deep link shows an empty state with a "telemetry is disabled" message.
The page has a filter bar with:
- Family - dropdown select for
control-plane,auth,data-denial, anddata-write. - Tenant - the tenant comes from the tenant switcher. Under All tenants a superuser also gets a select with all tenants and (no tenant), the latter showing only tenant-less events (anonymous authentication failures, node operations, and manifest imports). Tenant admins are pinned to their own tenant.
- Actor - filter by username.
- Action - a select populated from the exhaustive action vocabulary served by
GET /api/audit/actions. - Time range - from / to fields.
The event table shows timestamp, family badge, actor (with a (system) marker for system-realm actors), action, target, tenant, and an outcome badge (ok, denied, error). Each row is expandable to reveal the detail key-value map as a formatted list.
Pagination uses a keyset "Load more" button rather than numbered pages. There is no live polling; audit is a forensic view, so a manual Refresh button is provided.
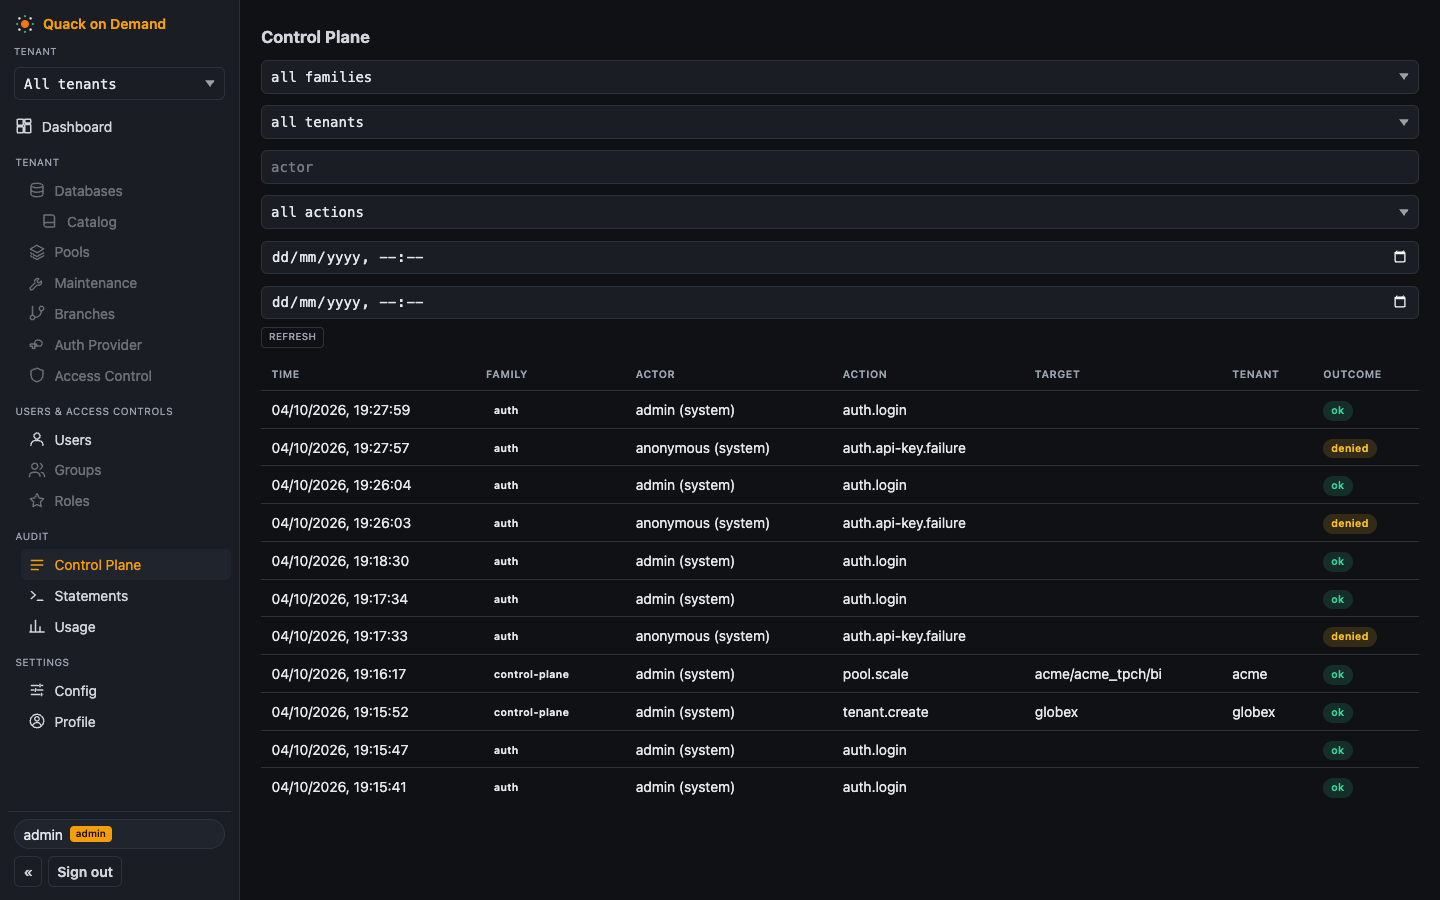
The four event families, the full action taxonomy, tenant scoping rules, retention, and the sanitization guarantee are documented on the Audit log page.
Statements
The Statements page (Audit > Statements, .../audit/statements) gives a time-series view of FlightSQL activity. It is available to superusers and tenant admins; with QOD_TELEMETRY_STORE=none a deep link shows the "telemetry is disabled" state.
A range picker (1h / 24h / 7d / 30d) sets the window shared by the charts and the statement table; ranges up to 48 hours use hourly buckets, wider ranges use daily buckets automatically. The tenant is the one picked in the tenant switcher (every tenant under All tenants); next to the range picker a pool select lists that tenant's pools. Changing a selection reloads immediately.
The three charts are:
- Throughput - stacked ok / denied / error statement counts per bucket.
- Error rate - percentage of statements per bucket that were denied or failed (transient, permanent, no-node, no-pool, or pin-lost).
- Latency percentiles - p50, p95, and p99 as separate lines. Percentiles come from the hourly rollup; at daily granularity the chart is replaced by a note that percentiles are available at hourly granularity.
Below the charts, a searchable statement table shows the raw rows for the selected window: timestamp, user, pool, status badge, duration (with the prepare-probe duration as subtext when present), and a truncated SQL preview. Clicking a row expands the full SQL (up to the 500-character recording cap) with syntax highlighting, plus the error text if any. The filter bar above the table takes a user filter, a status select (ok through pin-lost), and a free-text SQL substring search, applied on Refresh rather than per keystroke. Pagination uses a keyset "Load more" button.
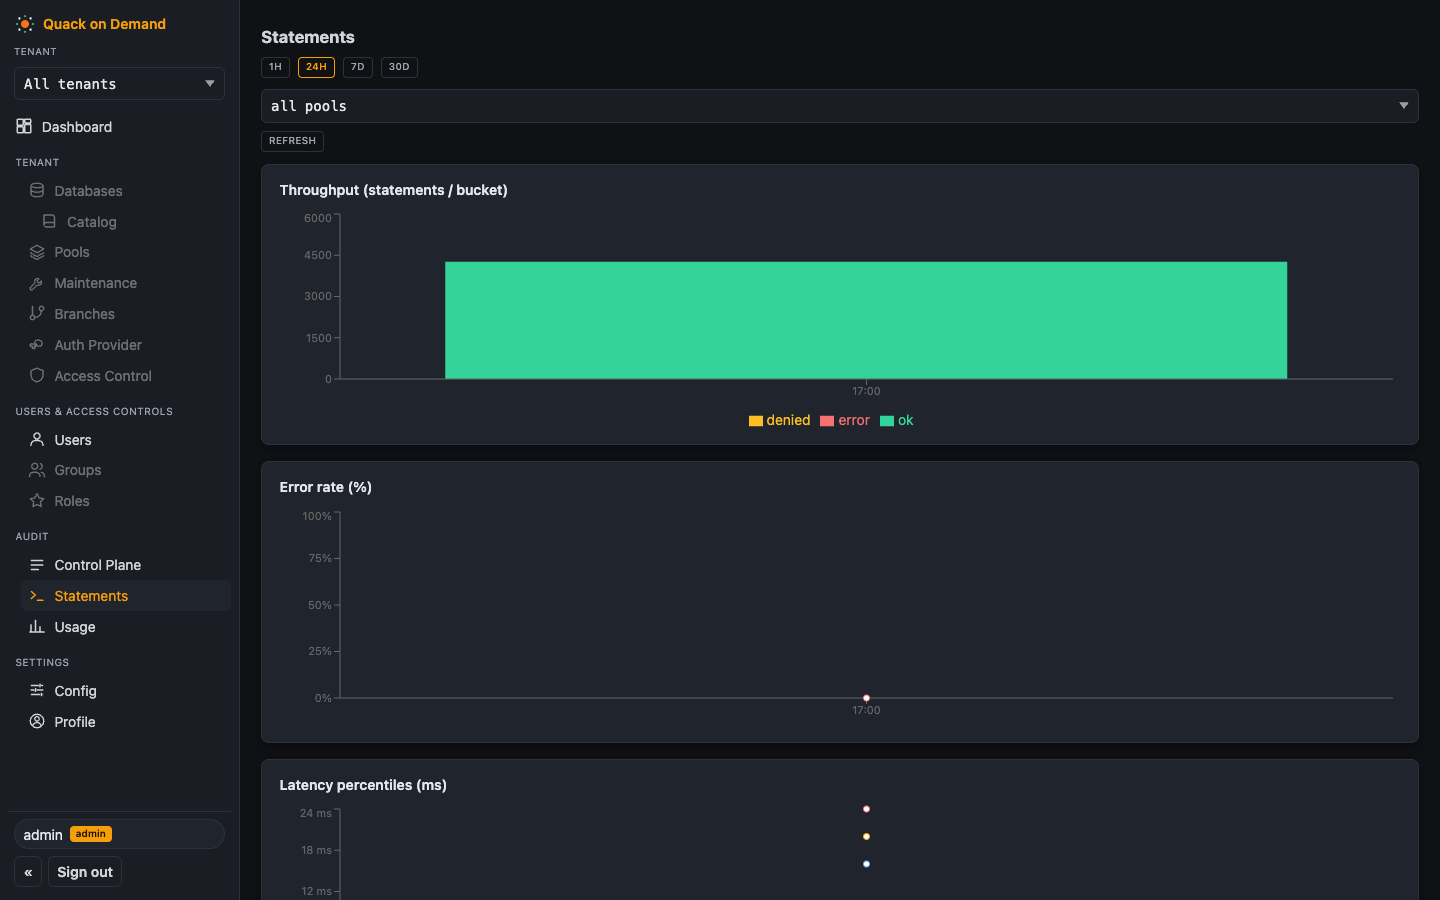
The storage model, watermark semantics, retention knobs, and the CLI recipes for both endpoints are covered on the Statement history and trends page.
Usage
The Usage page (Audit > Usage, .../audit/usage) is the durable metering ledger for FlightSQL activity, aggregated per tenant, pool, or user. It is available to superusers and tenant admins; with QOD_TELEMETRY_STORE=none a deep link shows the "telemetry is disabled" state. A note at the top states the metering unit's caveats (engine-ms is manager-measured execution time, the current day trails by up to one rollup tick, and accounting is best-effort measurement).
The page has a filter bar at the top with:
- Period picker - a month input (defaults to the current calendar month) or a custom date range, toggled by the "custom range" button. Custom ranges translate to a half-open
[from, to)interval in UTC before being sent to the API. - Group-by selector -
by tenant(superusers only),by pool, orby user. Tenant admins land on theby poolgrouping; theby tenantoption is hidden for them because the API pins them to their own tenant. - Metric toggle -
statements(total statement count) orengine-ms(summed execution time in milliseconds). Switching updates the chart; the totals table always shows all four measures. - Tenant and pool filters - the tenant is the one picked in the tenant switcher (every tenant under All tenants); the pool select lists that tenant's pools.
Below the filters, a stacked per-day bar chart shows each group's contribution over the period. The top 8 groups by engineMs receive distinct colors; all remaining groups are merged into a single gray "other" segment. Periods with no activity show an empty chart.
Below the chart, a totals table shows one row per group, sorted by engineMs descending, with columns for tenant, pool (when groupBy=pool), user (when groupBy=user), statements, errors, denied, and engine-ms. A Download CSV button above the table produces a client-side CSV using the column contract described on the Usage and accounting page.
The dataStart field in the API response drives a notice below the filter bar when the requested period starts before the retention horizon: "Data starts YYYY-MM-DD (older buckets purged)."
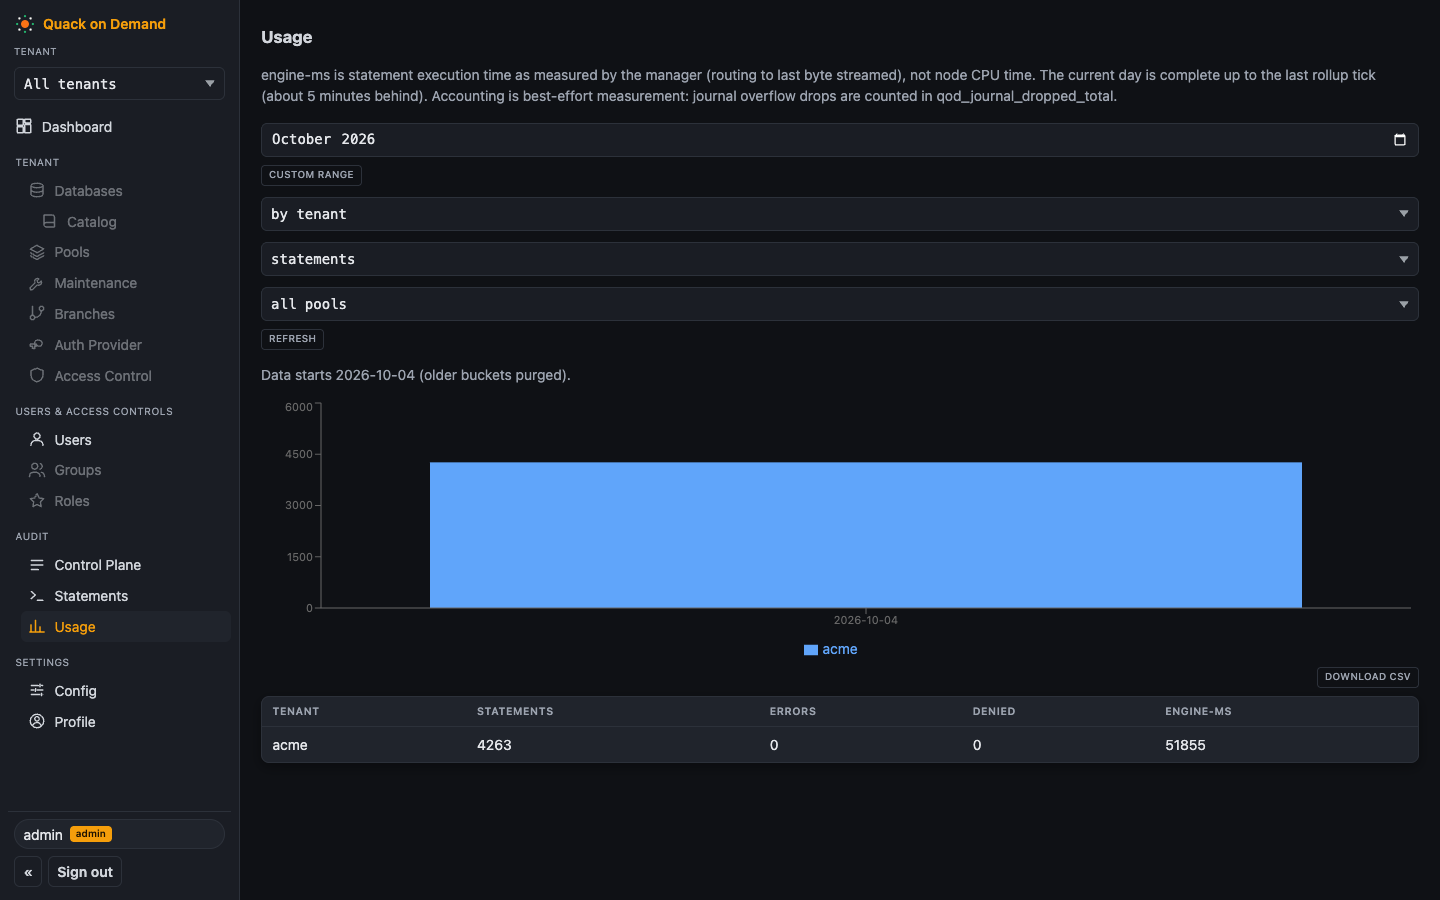
The full API reference, CSV column contract, retention knob, and scoping rules are documented on the Usage and accounting page.
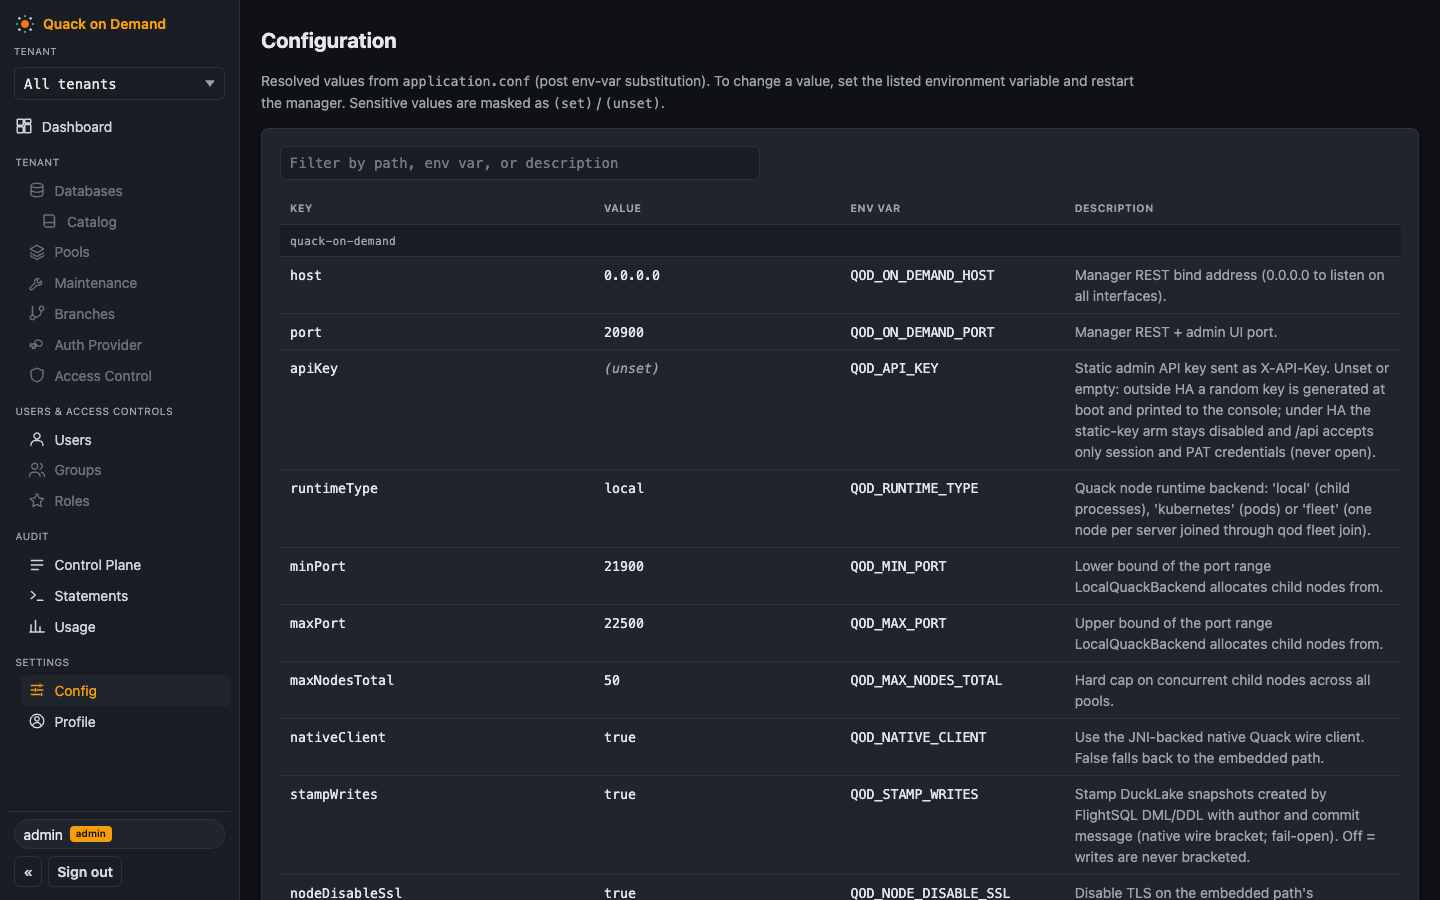
Config (superuser only)
Settings > Config (/ui/settings/config) is a cross-tenant view of the whole deployment, so it is restricted to a superuser admin. It has two parts:
- Configuration - the resolved
application.confrendered as a table of each key, itsQOD_*env var, description, and effective value, grouped by HOCON path section with a filter box that searches paths, env vars, and descriptions. Sensitive values are masked as(set)or(unset). This is the live equivalent of the Configuration reference. - Manifest - export the entire control-plane configuration as YAML (Download YAML) and re-import an edited file via a drag-and-drop dropzone with an explicit Apply step; a summary grid reports what the import touched (tenants, tenant-dbs, pools, roles, groups, users). The semantics, redaction, and apply rules are on the Manifest backup and restore page.